Content
Introduction
I. Essence and types of financial condition
1.1 The concept, essence of the financial condition and indicators characterizing it
1.2 Types of financial condition
II. Analysis of the financial condition of the enterprise
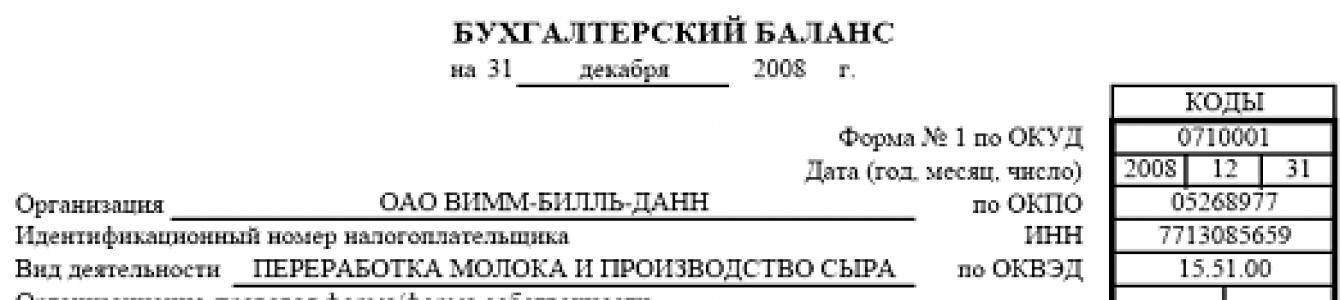
2.1 Brief economic characteristics of JSC "Wimm-Bill-Dann"
2.2 Structural analysis of assets and liabilities
2.5 Assessment of the financial condition by relative indicators
II. negotiable
Coefficient
ratios
negotiable and
non-current assets
Based on table 2, we can conclude that the increase in the sources of funds of the enterprise was most directed at increasing working capital (75%). The ratio of current and non-current assets increased its value (+0.29). However, it is impossible to draw specific conclusions about the financial condition of the enterprise, because the value of this coefficient is largely due to the industry-specific features of the circulation of enterprise funds.
A more specific analysis of the structure of assets and its changes is carried out separately for each aggregated type of assets (Tables 3, 4).
Table 3 Analysis of the structure of non-current assets(in thousand rubles)
| Indicators | Absolute values | Changes | |||||
| for the beginning of the year | at the end of the year | for the beginning of the year | at the end of the year | in absolute terms | in specific gravity | in % to the change in the total value of non-current |
|
| 1 | 2 | 3 | 4 | 5 | 6 | 7 | 8 |
| Intangible assets | 72 131 | 69 680 | 0,5 | 0,4 | -2 451 | -0,1 | -0,13 |
| Main facilities | 8 448 586 | 9 783 620 | 62,7 | 63,9 | +1 335 034 | +1,2 | +72,7 |
| Construction in progress | 2 705 578 | 2 896 392 | 20,1 | 18,9 | +190 814 | -1,2 | +10,4 |
Income. investments in mat. values |
- | - | - | - | - | - | - |
| Long-term financial investments | 1 983 868 | 2 264 035 | 14,7 | 14,8 | +280 167 | +0,1 | +15,25 |
Deferred tax assets |
268 617 | 301 291 | 2 | 2 | +32 674 | 0 | +1,78 |
Long term accounts receivable debt |
- | - | - | - | - | - | - |
| Other noncurrent assets | - | - | - | - | - | - | - |
| Total non-current assets | 13 478 780 | 15 315 018 | 100 | 100 | +1 836 238 | 0 | +100 |
For the purposes of analysis, the structure of non-current assets reflects long-term receivables, since these funds actually fall out of the current circulation of the enterprise.
The greatest contribution to the increase in the total value of non-current assets was made by the increase in fixed assets (72.7%). We can also highlight a less significant increase in construction in progress (10.4%) and long-term financial investments (15.25%).
The largest part of non-current assets is represented by production fixed assets (63.9%) and construction in progress (18.9%). Together with a high share of their growth, this characterizes the company's orientation towards creating material conditions for expanding its core activities.
Table 4 Analysis of the structure of current assets(in thousand rubles)
| Indicators | Absolute values | Specific gravity (%) in total |
Changes | ||||
| for the beginning of the year | at the end of the year | for the beginning of the year | at the end of the year | in absolute terms | in specific gravity | in % to the change in the total amount of current |
|
| 1 | 2 | 3 | 4 | 5 | 6 | 7 | 8 |
| Stocks | 2 974 314 | 3 369 776 | 39 | 25,7 | +395 462 | -13,3 | +7,21 |
| VAT on purchased assets | 133 626 | 150 219 | 1,75 | 1,15 | +16 593 | -0,6 | +0,3 |
Short-term accounts receivable debt |
4 383 916 | 8 031 431 | 57,43 | 61,25 | +3 647 515 | +3,82 | +66,56 |
| Short-term financial investments | 71 026 | 397 397 | 0,9 | 3,02 | +326 371 | +2,12 | +5,96 |
| Den. facilities | 64 933 | 1 160 398 | 0,85 | 8,85 | +1 095 465 | +8 | +20 |
| Other current assets | 5 714 | 4 199 | 0,07 | 0,03 | -1 515 | -0,04 | -0,03 |
Total current |
7 633 529 | 13 113 420 | 100 | 100 | +5 479 891 | 0 | +100 |
The greatest contribution to the increase in the total value of current assets was made by the increase in short-term receivables (66.56%), which has an extremely negative effect on the organization's activities. The increase in receivables is directly related to the increase in sales. However, the growth rate of debt (83.2%) is much higher than the growth rate of sales revenue (66.3%). Accordingly, the enterprise needs to look for the causes and ways to solve this problem.
The growth of cash (20%) cannot be assessed unambiguously. It is in the interests of the enterprise to keep on the accounts the minimum necessary amount of money that is needed for current operational activities. Insofar as cash, being at the cash desk or on bank accounts, do not generate income, they must be available at a safe minimum level.
The share of reserves in the overall structure is decreasing (-13.3%). Comparing the small growth rate of reserves (13.3%) with the growth rate of the company's financial results, we can conclude that raw materials and materials were used much better in the reporting period compared to the previous one. This indicates an increase in business activity.
Other indicators have changed slightly.
Analysis of the structure of liabilities
In general, the sources of funds can be divided into own and borrowed. The structure of liabilities is characterized by:
autonomy coefficient, calculated as a ratio:
k A \u003d Real equity capital / Total value of the sources of funds of the enterprise \u003d I C / B, (3)
where I C - the value of the real equity capital of the enterprise at the reporting date;
B - the total amount of liabilities (sources of funds) of the enterprise as of the reporting date;
ratio of borrowed and own funds, calculated by the formula:
k c/s = (Adjusted long-term liabilities + Adjusted short-term liabilities) / Real equity = (K T + K t + R p) / I C, (4)
where K T - long-term liabilities of the enterprise (long-term loans and borrowings received and other long-term liabilities) as of the reporting date;
K t - short-term loans and borrowings received as of the reporting date;
R p - accounts payable and other short-term liabilities and liabilities (including the enterprise's debt to participants (founders) for the payment of income, reserves for future expenses, etc.) as of the reporting date.
Normal limits for coefficients:
k A ³ 0.5, k g/s ≤ 1(5)
When calculating these coefficients, real equity capital coincides with the value of net assets. The total value of the sources of funds of the enterprise is formed as the difference between the balance sheet total and the debt of participants (founders) for contributions to the authorized capital.
The calculation of real equity and adjusted borrowings is presented in tables 5 and 6.
Table 5 Real equity(in thousand rubles)
To obtain the real equity capital of the enterprise, it is necessary to increase the total of section III “Capital and reserves” of the liabilities of the balance sheet (line 490) by the amount under the item “Deferred income” (line 640) of section V “Current liabilities” and reduce by the amount of debt of participants (founders) on contributions to the authorized capital (section II, line 244). Deferred income is treated as part of equity since. actually reflect the organization's debt to itself.
Table 6 (in thousand rubles)
Adjusted borrowings are obtained by reducing the sum of the totals of sections IV "Long-term liabilities" and V "Current liabilities" by the amount under the item "Deferred income" line 640 from section V "Current liabilities".
A preliminary analysis of the structure of liabilities is carried out on the basis of the data in Table 7.
Table 7 Analysis of the structure of liabilities(in thousand rubles)
| Indicators | Absolute quantities |
Specific gravity (%) in total liabilities |
Changes | ||||
| for the beginning of the year | at the end of the year | for the beginning of the year | at the end of the year | in absolute terms | in specific gravity | in % to the change in the total amount of liabilities | |
| 1 | 2 | 3 | 4 | 5 | 6 | 7 | 8 |
Real own |
11 835 136 | 14 297 255 | 44 | 50 | +2 462 119 | -6 | +34 |
| Adjusted borrowings | 9 277 173 | 14 131 183 | 56 | 50 | +4 854 010 | +6 | +66 |
| Total sources of funds | 21 112 309 | 28 428 438 | 100 | 100 | +7 316 129 | 0 | +100 |
Coefficient autonomy |
0,56 | 0,5 | × | × | -0,06 | × | × |
Coefficient ratios borrowed and own funds |
0,78 | 0,99 | × | × | +0,21 | × | × |
The increase in borrowed funds (66%) had the greatest impact on the increase in the property of the enterprise for the reporting period. Although the values of the relative indicators still correspond to the normal limits (5) and the obligations of the enterprise can be covered by its own funds, it can be said that the financial independence of the enterprise is decreasing. This confirms the decrease in the autonomy coefficient and the increase in the ratio of borrowed and own funds.
To increase the level of financial independence, it is necessary to replenish real equity capital and reduce short-term receivables.
A detailed analysis of the structure of liabilities and its changes is carried out separately for each aggregated type of liabilities (tables 8, 9).
Table 8 Analysis of the structure of real equity capital(in thousand rubles)
| Indicators | Absolute quantities |
Specific gravity (%) in total liabilities |
Changes | ||||
| for the beginning of the year | at the end of the year | for the beginning of the year | at the end of the year | in absolute terms | in specific gravity | ||
| 1 | 2 | 3 | 4 | 5 | 6 | 7 | 8 |
| 390 | 431 | 0,0033 | 0,003 | +41 | -0,0003 | +0,002 | |
Additional |
2 623 132 | 2 690 130 | 22,16 | 18,82 | +66 998 | -3,34 | +2,721 |
Spare |
52 | 108 | 0,0004 | 0,0008 | +56 | +0,0004 | +0,002 |
Undestributed profits (uncovered loss) |
9 131 771 | 11 542 261 | 77,16 | 80,73 | +2 410 490 | +3,57 | +97,903 |
| revenue of the future periods | 104 930 | 64 325 | 0,89 | 0,45 | -40 605 | -0,44 | -1,649 |
| Negative Adjustments | |||||||
Own shares repurchased from shareholders |
25 139 | 0 | 0,21 | 0 | - 25 139 | -0,21 | -1,021 |
Participants' debt (founders) on contributions to authorized capital |
- | - | - | - | - | - | - |
total real own |
11 835 136 | 14 297 255 | 100 | 100 | +2 462 119 | 0 | +100 |
In the structure of the real equity capital of the enterprise, the largest part is retained earnings (80.73% at the end of the period), a fairly large share compared to other items is additional capital (18.82% at the end of the period).
Table 8 shows that the increase in real equity capital was due to an increase in retained earnings (97.9%). The rest of the articles have changed slightly.
In accordance with the decision of the annual general meeting of shareholders dated June 27, 2008 on non-payment of dividends to shareholders in 2008, part of the net profit received from the results of operations in 2007 was used to finance capital investments and further develop the production base of JSC WBD .
The strategy of the enterprise in relation to the accumulation of own capital is determined by equity accumulation ratio, which shows the share of sources of own funds allocated for the development of core activities:
k n \u003d (Reserve capital + Retained earnings (uncovered loss)) / Real equity capital \u003d (I C res + R h) / I C, (6)
where And C res - the reserve capital of the enterprise as of the reporting date;
P h - retained earnings (uncovered loss);
And C - the real equity capital of the enterprise at the reporting date.
k n \u003d (52 + 9 131 771) / 11 835 136 \u003d 0.77 - at the beginning of the year;
k n \u003d (108 + 11 542 261) / 14 297 255 \u003d 0.81 - at the end of the year.
The positive dynamics of the coefficient indicates the progressive accumulation of equity as a result of the profitable activities of the enterprise.
Table 9 Analysis of the structure of borrowings (adjusted)(in thousand rubles)
| Indicators | Absolute quantities |
Specific gravity (%) in total liabilities |
Changes | ||||
| for the beginning of the year | at the end of the year | for the beginning of the year | at the end of the year | in absolute terms | in specific gravity | in % to the change in the total equity | |
| 1 | 2 | 3 | 4 | 5 | 6 | 7 | 8 |
| Long-term credits and loans | 3 674 257 | 5 012 925 | 39,6 | 35,5 | +1 338 668 | -4,1 | +27,6 |
Deferred tax obligations |
402 739 | 359 740 | 4,3 | 2,5 | -42 999 | -1,8 | -0,9 |
|
long term duties |
125 925 | 35 187 | 1,4 | 0,3 | -90 738 | -1,1 | -1,8 |
| Short-term loans and credits | 1 499 737 | 1 806 488 | 16,2 | 12,8 | +306 751 | -3,4 | +6,3 |
Short-term accounts payable debt |
3 442 886 | 6 729 743 | 37,1 | 47,6 | +3 286 857 | +10,5 | +67,7 |
| Debt to the participants (founders) for the payment of income | - | - | - | - | - | - | - |
|
upcoming expenses |
131 629 | 187 100 | 1,4 | 1,3 | +55 471 | -0,1 | +1,1 |
|
Short-term liabilities |
- | - | - | - | - | - | - |
Total borrowed |
9 277 173 | 14 131 183 | 100 | 100 | 4 854 010 | 0 | +100 |
The growth of short-term accounts payable (67.7%) and to a lesser extent long-term credits and loans (27.6%) influence the increase in borrowed funds. The most rational structure of borrowed funds is considered to be the structure in which the majority are long-term loans and loans, which contribute to the increase in the financial stability of the enterprise, therefore, the high growth rate of short-term accounts payable and its large share (47.6%) negatively affects the financial stability of the enterprise.
The ratio of short-term liabilities and permanent capital calculated by the formula:
k c.o./c.c = Adjusted short-term liabilities / (Real equity + Adjusted long-term liabilities) = (K t + R p) / (I C + K T),(7)
where K t - short-term loans and borrowings received as of the reporting date;
R p - accounts payable and other short-term liabilities and liabilities (including the enterprise's debt to participants (founders) for the payment of income, reserves for future expenses, etc.) as of the reporting date;
And C - the value of the real equity capital of the enterprise at the reporting date;
K T - long-term liabilities of the enterprise (long-term loans and borrowings received and other long-term liabilities) as of the reporting date.
k c/c > 1 is acceptable if k c.o/c.c ≤ 1.(8)
k k.o./p.k. = 5,074,252 / (11,835,136 + 4,202,921) = 0.32 - at the beginning of the year;
k k.o./p.k. = 8,723,331 / (14,297,255 + 5,407,852) = 0.44 - at the end of the year.
An increase in the value of this ratio indicates a decrease in the financial independence of the enterprise, mainly due to a significant increase in short-term liabilities.
2.3 Financial sustainability analysis
Analysis of the availability and sufficiency of real equity capital
The difference between real equity and authorized capital is the main initial indicator of the stability of the financial condition of the enterprise.
= (Real Equity) – (Share Capital) = (Additional Capital) + (Reserve Capital) + (Retained Earnings) + (Deferred Earnings) – (Uncovered Losses) – (Treasury Shares Repurchased from Shareholders) – (Debt of Members (founders) on contributions to the authorized capital).(9)
The positive terms of this expression can be conventionally called equity capital growth after the formation of the enterprise, the negative terms are diversion of own capital, which, among other things, may be associated with capital losses due to losses.
As can be seen from Table 10, the growth of equity capital many times exceeds the diversion of equity capital, and, therefore, the minimum condition for the financial stability of the enterprise is met. The increase in the difference between real equity capital and authorized capital for the reporting period (2,462,078 thousand rubles) is mainly due to the growth of retained earnings (2,410,490 thousand rubles).
Table 10 Analysis of the difference between real equity capital and authorized capital(in thousand rubles)
| Indicator | For the beginning of the year | At the end of the year | Changes |
| 1 | 2 | 3 | 4 |
| 1. Additional capital | 2 623 132 | 2 690 130 | +66 998 |
| 2. Reserve capital | 52 | 108 | +56 |
| 3. Retained earnings | 9 131 771 | 11 542 261 | +2 410 490 |
| 4. Deferred income | 104 930 | 64 325 | -40 605 |
| 5. Total increase in equity after the formation of the enterprise | 11 859 885 | 14 296 824 | +2 436 939 |
| 6. Uncovered damages | - | - | - |
7. Own shares repurchased from shareholders |
25 139 | 0 | |
| 8. Debt of participants (founders) on contributions to the authorized capital | - | - | - |
9. Total distraction of one's own capital |
25 139 | 0 | - 25 139 |
10. Difference of real own capital and authorized capital |
11 834 746 | 14 296 824 | +2 462 078 |
Analysis of the availability of reserves with sources of their formation
The ratio of the cost of reserves and the values of own and borrowed sources of their formation is one of the most important factors in the stability of the financial condition of the enterprise, along with the ratio of real equity and authorized capital. This is explained by the fact that stocks and costs characterize the production cycle, i.e. due to them the continuity of activity is ensured.
Total reserves(below in the formulas it is indicated by the symbol Z) of the enterprise is equal to the sum of the values \u200b\u200bfor the items of reserves of section II "Current assets" of the balance sheet (including VAT on acquired values, since before it is accepted for reimbursement in settlements with the budget, it must be financed from sources of formation of reserves).
To characterize the sources of formation of reserves, the following indicators are used, reflecting a different degree of coverage different types sources:
own working capital, calculated as the difference between the value of real equity capital and the sum of non-current assets and long-term receivables:
E C \u003d AND C -F, (10)
where And C - real equity;
F - non-current assets (at residual value) and long-term receivables;
availability of long-term sources of reserves formation is calculated by increasing the previous indicator by the amount of long-term liabilities:
E T \u003d E C + K T, (11)
where E C - the presence of own working capital;
K T - long-term liabilities;
total value of the main sources of reserves formation is equal to the sum of long-term sources and short-term loans and borrowings:
E S = E T + K t ,(12)
where E T is the presence of long-term sources of reserves formation;
K t - short-term credits and loans.
Three indicators of the availability of sources of formation of reserves correspond to three indicators of the availability of reserves with sources of their formation:
excess or shortage of working capital, equal to the difference between the value of own working capital and the value of stocks:
dE C = E C – Z;(13)
excess or shortage of long-term sources of stockpiling, equal to the difference between the value of long-term sources of formation of reserves and the value of reserves:
dE T = E T – Z;(14)
excess or shortage of the total value of the main sources of stock formation, equal to the difference between the value of the main sources of formation of reserves and the value of reserves:
dE S = E S - Z.(15)
The calculation of three indicators of the provision of reserves with sources of their formation allows us to classify financial situations according to the degree of their stability and express through a system of limitations of indicators:
1) absolute stability of the financial condition:
2) normal financial stability:
3) unstable financial condition:
dE T< 0,(18)
4) crisis financial condition:
dE T< 0,(19)
Table 11 Sources back-to-back analysis(in thousand rubles)
| Indicator | For the beginning of the year | At the end of the year | Changes |
| 1 | 2 | 3 | 4 |
| 1.Real equity | 11 835 136 | 14 297 255 | +2 462 119 |
| 2. Non-current assets | 13 478 780 | 15 315 018 | +1 836 238 |
| 3. Availability of own working capital | -1 643 644 | -1 017 763 | +625 881 |
| 4.Long-term liabilities | 4 202 921 | 5 407 852 | +1 204 931 |
5. Availability of long-term sources stock formation |
2 559 277 | 4 390 089 | +1 830 812 |
| 6.Short-term loans and credits | 1 499 737 | 1 806 488 | +306 751 |
| 7. The total value of the main sources of reserves formation | 4 059 014 | 6 196 577 | +2 137 563 |
| 8.Total inventory | 3 107 940 | 3 519 995 | +412 055 |
9. Surplus (+) or deficiency (-) own working capital |
-4 751 584 | -4 537 758 | +213 826 |
| 10. Surplus (+) or lack (-) of long-term sources of stockpiling | -548 663 | +870 094 | +1 418 757 |
11. Surplus (+) or deficiency (-) the total value of the main sources stock formation |
+951 074 | +2 676 582 | +1 725 508 |
| 12. Type of financial condition | unstable | Normal stability | × |
Table 11 shows that the company's own working capital is not enough to form stocks. However, the successful activity of the enterprise in 2008 brought him out of an unstable financial condition. To a greater extent, this was facilitated by the attraction of long-term loans and borrowings (+1,418,757). Also, the financial stability of the enterprise (reducing the lack of own working capital) was positively affected by the decrease in the share of non-current assets (table 2) by 10%; decrease in the share of reserves in the total value of current assets (table 4) by 13.3%; increase in real equity capital due to retained earnings (table 8). The absence of long-term receivables has a positive effect.
Long-term reserves coverage ratio calculated as a ratio:
k about \u003d E T / Z, (20)
Indicator limit:
k vol ≥ k a.i.(21)
k vol \u003d 2,559,277 / 3,107,940 \u003d 0.82 (at the beginning of the year);
k about \u003d 4,390,089 / 3,519,995 \u003d 1.25 (at the end of the year).
Coefficient of self-sufficiency :
k O \u003d Own working capital / Current assets, (22)
Normal limit:
k О ≥ 0.1. (23)
k O \u003d -1 643 644 / 7 633 529 \u003d -0.2 (at the beginning of the year),
k O \u003d -1,017,763 / 13,113,420 \u003d -0.08 (at the end of the year).
When calculating the following financial ratios, long-term liabilities of the organization are also included in the composition of own working capital, because the enterprise can freely dispose of these funds for a long time.
Agility factor calculated by the formula:
k m \u003d E T / I C .(24)
k m \u003d 2,559,277 / 11,835,136 \u003d 0.22 (at the beginning of the year);
k m \u003d 4,390,089 / 14,297,255 \u003d 0.31 (at the end of the year).
Coefficient of autonomy of sources of reserves formation :
k a.i = E T / E S .(25)
k a.i = 2,559,277 / 4,059,014 = 0.63 (at the beginning of the year);
k a.i = 4,390,089 / 6,196,577 = 0.71 (at the end of the year).
The reserve coverage ratio with long-term sources corresponds to the limitation (21), has a positive trend (+0.43).
The values of the coefficient of provision with own sources at the beginning and at the end of the year do not correspond to the limitation (23). At the same time, in the economic literature it is recommended to evaluate the structure of the balance sheet of an enterprise as unsatisfactory. The dynamics of the indicator change is positive (+0.12).
The maneuverability coefficient at the end of the reporting period (0.31) shows that 31% of own funds are in a mobile form and the company can relatively freely maneuver them. The value of the indicator increased (+0.09) compared to the previous year, which indicates a positive trend in the change in the financial stability of the enterprise and confirms the conclusions made on the basis of table 11.
The coefficient of autonomy of the sources of formation of reserves at the end of the year (0.71) shows that the share of own working capital in the total amount of the main sources of formation of reserves is 71%. The growth of the coefficient (+0.08) is assessed positively, because reflects a trend towards a decrease in the dependence of the enterprise on borrowed sources (in this case from short term).
2.4 Analysis of liquidity and solvency
Analysis of the liquidity of the balance sheet consists in comparing the funds of the asset, grouped by the degree of their liquidity and arranged in descending order, with the liabilities of the liability, grouped by maturity and arranged in ascending order.
Depending on the degree of liquidity, i.e. the rate of conversion into cash, the assets of the enterprise are divided into the following groups:
A1) absolutely and most liquid (realizable) - cash and short-term financial investments (securities);
A2) quickly realizable - accounts receivable, payments on which are expected within 12 months after the reporting date, other current assets;
A3) slow-moving - a group of items "Inventories" of section II of the balance sheet asset (together with VAT), with the exception of the item "Deferred expenses", items "Profitable investments in material assets" and "Long-term financial investments" of section I of the balance sheet asset, receivables, payments for which are expected more than 12 months after the reporting date;
A4) difficult to sell - items in section I of the asset of the balance sheet "Non-current assets" with the exception of items accounted for in the previous group, as well as "Deferred expenses" in section II of the balance sheet.
Liabilities of the balance sheet are grouped by urgency their payment:
P1) the most urgent liabilities - accounts payable, debts to participants (founders) for the payment of income and other short-term liabilities; P2) short-term liabilities - short-term loans and credits; P3) long-term and medium-term liabilities - long-term loans and credits; P4) permanent liabilities, i.e. own funds, - articles of section III of the liabilities side of the balance sheet. To maintain the balance of assets and liabilities, the total of this group is reduced by the amount of losses (section III of the liabilities) and increased by the amounts under the items “Deferred income”, “Reserves for future expenses”.
Table 12 Balance liquidity analysis(in thousand rubles)
| Assets | For the beginning of the year | At the end of the year | Liabilities | For the beginning of the year | At the end of the year | Payment surplus or deficiency | |
| For the beginning of the year | At the end of the year | ||||||
| 1 | 3 | 4 | 5 | 7 | 8 | 9 | 10 |
| 1. Most liquid | 135959 | 1557795 | 1. Most urgent | 3442886 | 6729743 | -3306927 | -5171948 |
|
realizable |
4389630 | 8035630 | 2. Short term | 1499737 | 1806488 | 2889893 | 6229142 |
| 3. Slow to implement | 5020082 | 5703898 | 3. Long-term and medium-term | 4202921 | 5407852 | 817161 | 296046 |
|
realizable |
11566638 | 13131115 | 4. Permanent | 11966765 | 14484355 | -400127 | -1353240 |
| Balance | 21112309 | 28428438 | Balance | 21112309 | 28428438 | × | × |
The balance is considered absolutely liquid if:
A3 ≥ P3,(26)
When comparing the results of the first group for assets and liabilities (A1 and P1, terms up to 3 months), there is a discrepancy with condition (26), from which we can conclude that the liquidity of the balance sheet differs to some extent from absolute. That. current receipts do not fully cover current payments. A deficiency in one group of assets is compensated by an excess in another (A2), although compensation takes place only in terms of value, since in a real payment situation, less liquid assets cannot replace more liquid ones.
Comparison of other groups satisfies condition (26).
Comparison of the results of the second group of assets and liabilities (A2 and P2, terms from 3 to 6 months) shows a trend of increasing current liquidity in the near future, indicates the solvency of the organization for the next period of time.
Comparison of slow-moving assets with long-term and medium-term liabilities (A3 and P3) reflects promising liquidity, solvency in a relatively distant future.
The analysis of the liquidity of the balance sheet carried out according to the above scheme is approximate, mainly due to the fact that the correspondence between the degree of liquidity of assets and the maturity of liabilities in liabilities is planned approximately.
To assess the liquidity of an enterprise, three relative indicators are used, which differ in the set of liquid assets considered as coverage for short-term liabilities.
The instant liquidity of an enterprise is characterized by absolute liquidity ratio :
k a.l = (Cash + Short-term financial investments) / Adjusted short-term liabilities. (27)
The liquidity of an enterprise, taking into account future receipts from debtors, characterizes current ratio :
k l \u003d (Cash + Short-term financial investments + Short-term receivables) / Adjusted short-term liabilities. (28)
The projected payment capabilities of the enterprise, subject to the repayment of short-term receivables and the sale of existing reserves, reflects total coverage ratio :
k p \u003d (Cash + Short-term financial investments + Short-term accounts receivable + Inventory, including unwritten VAT) / Adjusted short-term liabilities. (29)
Table 13 Analysis of liquidity indicators of the enterprise(in thousand rubles)
It should be noted that the coefficient standards officially recommended and widely used in the economic literature (column 2) should be considered somewhat overestimated. The difference between real coefficients and normative ones is influenced by: the specifics of the industry, the activities of enterprises, the domestic economy compared to foreign ones, the heterogeneous structure of debt repayment periods.
Absolute liquidity ratio, having at the end of the year the value of 0.18 shows that 18% of short-term liabilities are subject to repayment every day. The value of the coefficient has increased significantly compared to the previous period, and although it does not correspond to the normal limit, it should be assessed positively. To increase the level of absolute liquidity, the company needs to restrain the growth of accounts receivable, monitor its uniform and timely repayment, and reduce the level of short-term liabilities.
The current liquidity ratio, which has a value of 1.1 at the end of the year, shows that cash and future receipts from current activities cover current debts. Table 13 shows that the situation has become much better compared to the previous period (+0.21). Correlating this fact with the data in Table 11, we can conclude that the increase in the current liquidity ratio was facilitated by the growth in the provision of reserves with own working capital and long-term loans and borrowings.
The coverage ratio at the beginning and at the end of the period has not changed its value and does not correspond to the officially recommended limit. The fact that k p > 1 should already be assessed positively. The value of the coefficient (1.5) means that by the end of the reporting period, current assets exceed short-term liabilities by 50% and indicates that the company may have difficulties in case of urgent repayment of short-term debt. To increase the ratio, the company needs to replenish real equity capital.
Solvency ratio calculated by the formula:
k o.p = Assets of the enterprise / Adjusted borrowings of the enterprise = 1 + I C / (R P + K t + K T).(30)
Normal Coefficient Limit:
k o.p ³ 2.(31)
k o.p = 21112309 / 9277173 = 2.28 (at the beginning of the year);
k o.p = 28428438 / 14131183 = 2.01 (at the end of the year).
Although the dynamics of the change in the coefficient is negative, its value corresponds to the normal limit (31), from which we can conclude that the organization remains solvent.
The fact that the company is actively using borrowed funds, i.e. banks and financial credit companies evaluate the enterprise as an important solvent client and finance its activities.
To summarize the results of the calculations, it is necessary to bring all the relative indicators characterizing the financial condition of the enterprise into a summary table.
Table 14 Summary table of the main coefficients characterizing the financial condition of the enterprise
| Indicator | normal limit | For the beginning of the year | At the end of the year | Change |
| 1 | 2 | 3 | 4 | 5 |
| 1. The ratio of current and non-current assets | - | 0,57 | 0,86 | +0,29 |
| 2. Autonomy coefficient | ³ 0.5 | 0,56 | 0,5 | -0,06 |
3. Ratio ratio borrowed and own funds |
≤ 1 | 0,78 | 0,99 | +0,21 |
4. Accumulation rate equity |
- | 0,77 | 0,81 | +0,04 |
| 5. The ratio of short-term liabilities and permanent capital | ≤ 1 | 0,32 | 0,44 | +0,12 |
| 6. Agility factor | 0,5 | 0,22 | 0,31 | +0,09 |
| 7. Coefficient of autonomy of sources of reserves formation | - | 0,63 | 0,71 | +0,08 |
| 8. Long-term reserves coverage ratio | ≥ k a.i. | 0,82 | 1,25 | +0,43 |
9. Security ratio own sources |
≥ 0,1 | -0,2 | -0,08 | +0,12 |
10. Absolute coefficient liquidity |
³ 0.2 | 0,03 | 0,18 | +0,15 |
11. Coefficient of current liquidity |
³ 1 | 0,89 | 1,1 | +0,21 |
| 12. Coverage ratio | ³ 2 | 1,5 | 1,5 | 0 |
13. Coefficient of overall solvency |
³ 2 | 2,28 | 2,01 | -0,27 |
In order to more accurately study the dynamics of the coefficients and their impact on the state of the enterprise, ideally, it is necessary to use the values of these indicators according to the data of the enterprise in the optimal year of operation (i.e., the best indicators) or a trend series. In the absence of such information, benchmarks for financial indicators, common in the economic literature, are used.
The dynamics of the ratio of current and non-current assets is positive. The increase in its value is associated with an increase in the share of current assets and, accordingly, with a decrease in the share of current assets in the structure of the enterprise's balance sheet. The value of the coefficient is largely due to the industry-specific features of the circulation of enterprise funds. However, during the analysis it turned out that the largest increase in the working capital of the enterprise is associated with an unreasonably large increase in short-term receivables (p. 20), so the increase in the value of the indicator under these conditions cannot be assessed positively.
A decrease in the autonomy coefficient and an increase in the ratio of borrowed and own funds indicate an increase in the financial dependence of the enterprise on borrowed funds. However, the values of these indicators correspond to the normal limits. Therefore, it cannot be said that their change had a negative impact on the activities of the enterprise.
The change in these ratios is associated to a greater extent with an increase in short-term liabilities (table 9), which negatively affects the financial condition of the enterprise. However, there is also a significant increase in long-term liabilities (table 9), which contributed to the company's exit from an unstable financial condition (table 11). Accordingly, this was reflected in the positive dynamics of the relative indicators of the financial condition of the enterprise - the coefficient of maneuverability, the coefficient of autonomy of the sources of formation of reserves, the coefficient of provision of reserves with long-term sources.
The dynamics of the relative liquidity indicators of the enterprise is positive - this is due to an increase in cash and short-term receivables (table 4). The value of the absolute liquidity ratio does not correspond to the recommended ones, this is also confirmed by the non-fulfillment of the condition A1 ≥ P1 (table 12). This is mainly due to the large share of short-term receivables (Table 4). Therefore, the current liquidity ratio corresponds to the normal limit, which indicates the ability of the enterprise to cover current liabilities subject to repayment of receivables.
The coverage factor does not meet the limitation common in the literature. However, the standard is overestimated and for a particular industry can be determined only on the basis of statistical processing of data from a number of enterprises. To increase the level of this ratio, it is necessary to replenish real equity capital, to restrain the growth of non-current assets and long-term receivables. At this enterprise, real equity is large enough and does not require a large increase, there is a decrease in the level of non-current assets and there is no long-term receivables. There is no change in the value of the indicator. It can be concluded that k p = 1.5 is optimal for the enterprise.
The dynamics of the overall solvency ratio is negative, which is associated with the attraction a large number borrowed money. However, the value of the coefficient corresponds to the normal limit, and the enterprise remains solvent.
Summing up, we can say that the company has improved its financial condition, so the measures that need to be recommended should be aimed at maintaining and consolidating the achieved position.
Reserves for improving the efficiency of this enterprise should be based on a decrease in the share of short-term receivables and cash.
Because Since the growth rate of short-term receivables (83.2%) is higher than the growth rate of sales revenue (66.3%), it can be said that a sharp increase in receivables is associated not only with an increase in sales volumes, but also with an incorrect credit policy of the enterprise in relation to to buyers and customers, other debtors.
We can suggest the following ways to optimize the credit policy in relation to debtors:
Timely execution of settlement documents;
Providing discounts for early repayment debt;
Release of goods on the terms of prepayment;
Registration of a transaction with buyers with a commercial bill with interest for deferred payment;
Introduction of penalties for late payment;
Assignment of the right to claim;
Factoring;
Insurance protection.
Optimization (reduction) of the size and share of receivables will increase the turnover of capital and minimize the risks associated with non-payment of debts, which will positively affect the financial results and financial condition of the enterprise.
The amount of cash that a well-managed enterprise needs is a safety stock intended to cover short-term imbalances. cash flows. The increase in cash balances in bank accounts is due to the level of imbalance in cash flows. The growth rate of funds in the analyzed period amounted to 1687%. An excess of free cash can be used to pay off obligations, invest in material assets and securities, and replenish reserve capital.
A decrease in short-term receivables and cash on hand and on the current account will entail a decrease in the value of current assets, which will accordingly accelerate the turnover of current assets, increase the profitability of current assets, as a result will cause an increase in sales revenue, sales profit, net profit.
In order to determine the effect of the implementation of measures, it is necessary to calculate the turnover ratio of current assets (k o.a.), the ratio of profit from sales to current assets (k p / o.a.) and the profitability ratio of current assets (R o.a. ). These coefficients show how many rubles of sales proceeds, sales profit, net profit, respectively, were received per 1 ruble of current assets:
k o.a. = Sales revenue / Current assets;(32)
k p/o.a. = Profit from sales / Current assets; (33)
R o.a. = Net profit / Current assets, (34)
where current assets is their average value for the period, calculated as: Current assets = (7,633,529 + 13,113,420) / 2 = 10,373,474.5 thousand rubles.
k o.a. \u003d 44,739,813 / 10,373,474.5 \u003d 4.31 rubles. from 1 ruble;
k p/o.a. \u003d 2,658,214 / 10,373,474.5 \u003d 0.26 rubles. from 1 ruble;
R o.a. \u003d 1,282,688 / 10,373,474.5 \u003d 0.12 rubles. from 1 ruble.
Using these coefficients, it is necessary to calculate the change in sales revenue (∆V), sales profit (∆P) and net profit (∆P h) after the implementation of the measures.
The average amount of accounts receivable for the period = (4,383,916 + 8,031,431) / 2 = 6,207,673.5 thousand rubles.
Reduction of receivables by 25% i.e. by RUB 1,551,918.375 thousand will result in the following performance changes:
∆B = 1,551,918.375 thousand rubles × RUB 4.31 from rub. = 6,688,768 thousand rubles.
∆P = 1,551,918.375 thousand rubles × 0.26 rub. from rub. = 403,499 thousand rubles.
∆P h \u003d 1,551,918.375 thousand rubles. × 0.12 rub. from rub. = 186,230 thousand rubles.
The average amount of funds for the period = (64,933 + 1,160,398) / 2 = 612,665.5 thousand rubles.
Reducing free cash by 80% i.e. by 490,132.4 thousand rubles. will result in the following performance changes:
∆B = 490 132.4 thousand rubles. × RUB 4.31 from rub. = 2 112 471 thousand rub.
∆P = 490 132.4 thousand rubles. × 0.26 rub. from rub. = 127,434 thousand rub.
∆P h \u003d 490 132.4 thousand rubles. × 0.12 rub. from rub. = 58,816 thousand rubles.
Accordingly, other things being equal, the financial results of the enterprise will take the values reflected in table 15.
A decrease in short-term accounts receivable should also lead to a decrease in the share of short-term liabilities and an increase in the share of equity in the company's liabilities, respectively, the relative indicators of the company's financial condition will improve. Below are the calculations for some of them.
The decrease in receivables at the end of the reporting period by 25% will amount to 2,007,857.75 thousand rubles, respectively, short-term liabilities will decrease by the same amount and the equity capital of the enterprise will increase at the end of the reporting period. From here:
the autonomy coefficient at the end of the reporting period will take the value:
k A \u003d (14,297,255 + 2,007,857.75) / 28,428,438 \u003d 0.57;
ratio of borrowed and own funds:
coefficient of the ratio of short-term liabilities and permanent capital: k k.o./p.k.
overall solvency ratio:
k o.p = 28,428,438 / (14,131,183 - 2,007,857.75) = 2.35.
Table 15 Financial results of the enterprise(in thousand rubles)
| Indicator | actual value | Significance after the implementation of measures | Rate of change, % |
| Decrease in receivables | |||
| current assets | 10 373 474,5 | 8 821 556,125 | -15 |
| Sales revenue | 44 739 813 | 51 428 581 | 15 |
| 4,31 | 5,83 | 35,3 | |
| Sales profit | 2 658 214 | 3 061 713 | 15,2 |
| 0,26 | 0,35 | 34,6 | |
| Net profit | 1 282 688 | 1 468 918 | 14,5 |
| 0,12 | 0,17 | 41,7 | |
| Decrease in free cash | |||
| current assets | 10 373 474,5 | 9 883 342,1 | -4,7 |
| Sales revenue | 44 739 813 | 46 852 284 | 4,7 |
| Current assets turnover ratio, rub. from 1 ruble | 4,31 | 4,74 | 10 |
| Sales profit | 2 658 214 | 2 785 648 | 4,8 |
| The ratio of profit from sales to current assets, rub. from 1 ruble | 0,26 | 0,28 | 7,7 |
| Net profit | 1 282 688 | 1 341 504 | 4,6 |
| Return on current assets, rub. from 1 ruble | 0,12 | 0,14 | 16,7 |
findings
The work performed allows us to draw the following conclusions:
1. The financial condition of Wimm-Bill-Dann OJSC at the end of the reporting period is normally stable. During the reporting period, the company improved its financial condition - at the beginning of the year it was unstable.
2. The improvement of the financial condition of the enterprise was facilitated by the attraction of long-term sources of formation of reserves (+1,830,812 thousand rubles) and the increase in real equity capital (+2,462,119 thousand rubles), mainly due to retained earnings (an increase of 97. 9% in real equity change)
3. The financial results of the enterprise have a positive trend. In the reporting period, WBD JSC used its assets more efficiently, as evidenced by the excess of the growth rate of sales proceeds (66.3%) over the growth rate of assets (34.7%).
4. In the reporting period, the company used raw materials and materials much better than last year - the growth rate was only 13.3%. A high proportion of changes in fixed assets in the total value of non-current assets (72.7%) indicates the company's orientation towards creating material conditions for expanding activities. The absence of long-term receivables is also positive. However, there are significant negative aspects in the activities of the enterprise: high growth rates of short-term receivables (83.2%) and cash on hand and on the current account (1687%). Therefore, the company should take a number of measures to strengthen the financial condition, mainly in relation to reducing the share and growth rate of receivables and free cash.
5. To reduce receivables, the following measures are recommended for the enterprise:
release of goods to buyers and customers on a prepaid basis. This is expedient from the point of view that JSC WBD is a large well-known enterprise that produces high-quality products, so buyers and customers will take such a measure in order to maintain profitable relations;
· Registration of transactions with buyers by commercial bill with interest for deferred payment. Receipt of a bill does not reduce the amount of receivables in the company's current assets, however, it provides the holder with more options for managing and optimizing receivables. The presence of the bill guarantees the holder of the bill the receipt of the specified amount after a certain period, allows him to pay this bill with his counterparties for the goods or services received. If necessary, the holder of the bill will receive funds on this bill earlier than the term specified in the bill, having realized it to third parties;
· for other debtors, it is advisable to introduce or increase penalties for late payment;
If there is an untimely preparation of settlement documents, then it is necessary to optimize this process as well.
6. It is expedient to allocate a part of free funds for long-term financial investments, since at the same time, the value of current assets will decrease, which will accelerate their turnover, and additional income will be received.
7. A 25% decrease in short-term receivables leads to an increase in sales revenue by 6,688,768 thousand rubles. (15%), profit from sales by 403,499 thousand rubles. (15.2%) and net profit by 186,230 thousand rubles. (14.5%). The decrease in cash on hand and on the current account of the enterprise by 80% leads to an increase in sales revenue by 2,112,471 thousand rubles. (4.7%), profit from sales by 127,434 thousand rubles. (4.8%) and net profit by 58,816 thousand rubles. (4.6%). The implementation of measures in the aggregate will increase sales revenue by 8,801,239 thousand rubles. (19.7%), profit from sales by 530,933 thousand rubles. (20%) and net profit by 245,046 thousand rubles. (19.1%). The dynamics of performance indicators will positively affect the financial condition of the enterprise. The relative indicators of the financial condition of the enterprise will improve. That. after the implementation of measures, the financial condition will remain stable, but prerequisites will be created for its preservation.
List of used literature
1. Bakanov M. I., Melnik M. V., Sheremet A. D. Theory of economic analysis. Textbook. / Ed. M. I. Bakanova. - 5th ed., revised. and additional - M.: Finance and statistics, 2005, - 536 p.: ill.
2. Berdnikova T. B. Analysis and diagnostics of the financial and economic activities of the enterprise: Proc. allowance. – M.: INFRA-M, 2007. – 216 p. - (Higher education).
3. Kovalev VV Financial management: theory and practice. - 2nd ed., revised. and additional - M .: TK Velby, Publishing House Prospekt, 2007. - 1024 p.
4. Melnik M. V., Gerasimova E. B. Analysis of the financial and economic activities of the enterprise: Tutorial. - M.: FORUM: INFRA-M, 2008. - 192 p. - (Professional education).
5. Savitskaya GV Analysis of the economic activity of the enterprise: Textbook. – 5th ed., revised. and additional – M.: INFRA-M, 2009. – 367 p. - (Higher education).
6. Sheremet AD Analysis and diagnostics of the financial and economic activities of the enterprise: Textbook. – M.: INFRA-M, 2009. – 367 p. - (Higher education).
7. Sheremet A. D. Complex analysis economic activity. - M.: INFRA-M, 2006. - 415. - (Higher education).
8. Sheremet A. D., Negashev E. V. Methods of financial analysis of the activities of commercial organizations. - M.: INFRA-M, 2003. - 237 p.
9. Sheremet A. D., Negashev E. V. Methods of financial analysis of the activities of commercial organizations. - 2nd ed., revised. and additional – M.: INFRA-M, 2010. – 208 p.
10. Official website of JSC "Wimm-Bill-Dann" http://www.wbd.ru.
Applications
Appendix 1


Annex 2
«WIMM-BILL-DANN FOOD PRODUCTS OPEN JOINT-STOCK COMPANY ANNUAL REPORT 2008 2 I. INFORMATION ABOUT THE COMPANY...»
-- [ Page 1 ] --
ANNUAL REPORT OF WIMM-BILL-DANN FOOD PRODUCTS OPEN JOINT-STOCK COMPANY for 2008 2
I. INFORMATION ABOUT THE COMPANY
OPEN JOINT STOCK COMPANY "WIMM-BILL-DANN PRODUCTS"
POWER" (hereinafter referred to as the "Company") is established and operates in accordance with
joint-stock companies”, Law “On foreign investments in Russian Federation»
and other applicable Russian legislation and the Charter of the Company.
Full corporate name of the Company:
In Russian - OPEN JOINT STOCK COMPANY "WIMM-BILLDANN FOOD PRODUCTS";
On the English language– Open Joint Stock Company “WIMM-BILL-DANN FOODS”.
Abbreviated name of the Company:
In Russian - JSC "WBD PP";
In English - "WBD FOODS".
1.3. Location of the Company (legal address): 109028, Moscow, Yauzsky boulevard, 16/15, room. 306.
Postal address of the Company: 109028, Moscow, Yauzsky boulevard, 16/15, room. 306.
1.4. Date and number of state registration of the Company - registered by the State Registration Chamber under the Ministry of Justice of the Russian Federation on May 31, 2001 No. P-15968.16.
The main state registration number (OGRN) 1037700236738 dated February 19, 2003, registered by the Interdistrict Inspectorate of the Ministry of Taxes of Russia No. 39 for Moscow.
1.5. Information about the authorized capital of the Company.
The authorized capital of the Company is 880,000,000 (Eight hundred and eighty million) rubles and is divided into 44,000,000 (Forty-four million) ordinary registered shares with the same nominal value of 20 (Twenty) rubles each.
There were no changes in the capital of the Organization during the reporting period.
The number of shares issued and fully paid as at 31 December 2008 was 44,000,000.
Promotion details:
Number of securities in the issue: 35,000,000 pieces Total volume of the issue: 700,000,000 rubles
Information about the state registration of the issue:
Number of securities in the issue: 9,000,000 pieces Total volume of the issue: 180,000,000 rubles
Information about the state registration of the issue:
Date of registration: 30.10.2001 Registration number: 1-02-06005-A State registration authority: FCSM of Russia Combination of securities issues By order of the FCSM of Russia dated February 6, 2004 No. 04-305/r, additional issues of emissive securities were merged , as a result of which the state registration number 1-02-06005-A of October 30, 2001 was annulled.
The specified issue of ordinary registered non-documentary shares of the Open Joint Stock Company Foodstuffs was assigned the Wimm-Bill-Dann state registration number 1-01-06005-A dated February 6, 2004.
Number of securities of the joint issue: 44,000,000 pieces Total volume of the issue: 880,000,000 rubles.
1.6. The number of persons registered in the register of shareholders is 15.
1.7. Information about the Company's auditor:
By the decision of the annual general meeting of shareholders (Minutes No. 27-06 dated 03.07.2008) by the auditor of the Open Joint Stock Company "Wimm-Bill-Dann Foods"
assigned to Ernst & Young LLC
Full company name – Ernst & Young Limited Liability Company
The number and date of the license to carry out audit activities - No. E 002138 dated September 30, 2002, issued by the Ministry of Finance of the Russian Federation.
1.8. The register of shareholders of OJSC Wimm-Bill-Dann Foods is maintained by a specialized registrar - OJSC Central Moscow Depositary, license number 10-000-1-00255 dated September 13, 2002.
Location: 107078, Moscow, Orlikov lane, building 3, bldg. "AT".
Postal address: 105082, Moscow, st. Bolshaya Pochtovaya, house 34, building 8.
1.9. List of mass media in which information about the Company is published: "Wall Street Journal" (New York, USA), "Supplement to the Bulletin of the Federal Financial Markets Service", "Moskovskaya Pravda".
1.10. Structure of the Company's management bodies.
The General Meeting of Shareholders is the supreme management body of the Company;
Board of Directors - the management body of the company in the intervals between general meetings of shareholders;
Chairman of the Management Board - the sole executive body of the Company;
The Management Board is the collegial executive body of the Company.
ANNUAL REPORT OF WIMM-BILL-DANN FOOD PRODUCTS OPEN JOINT-STOCK COMPANY for 2008 4
1.11. Composition of the Board of Directors of the company, including information on changes in the composition of the Board of Directors of the company that took place in the reporting year, and information about the members of the Board of Directors of the company, including their brief biographical data and ownership of the company's shares during the reporting year; information on transactions for the acquisition or alienation of shares of a joint-stock company:
Composition of the Board of Directors of the Company, elected at the Annual General Meeting of Shareholders on June 27, 2008 (Minutes No. 27-06 of the Annual General Meeting of Shareholders of Wimm-Bill-Dann Foods Open Joint Stock Company dated July 03, 2008)
– – –
1. Guy de Selye
2. Dubinin Mikhail Vladimirovich
3. Yushvaev Gavril Abramovich
4. E. Linwood (Tip) Tipton
6. Orlov Alexander Sergeevich
7. Plastinin Sergey Arkadievich
8. Yakobashvili David
9. Yasin Evgeny Grigorievich
10. Kostikov Igor Vladimirovich
11. Jacques Vincent
Society "Wimm-Bill-Dann Food":
Purchase and sale transaction, in accordance with which, on August 21, 2008, 500,000 ordinary shares (state registration number of the issue 1-01A dated February 6, 2004) were written off from the account of David Yakobashvili (share transfer to a short-term loan while retaining the rights of beneficial ownership of shares ).
Purchase and sale transaction, in accordance with which on September 11, 2008, 1,000,000 ordinary shares were written off (state registration number of the issue 1-01A dated February 6, 2004) from the account of David Yakobashvili (share transfer to a short-term loan with retention of the rights of beneficial ownership of shares ).
ANNUAL REPORT OF WIMM-BILL-DANN FOOD PRODUCTS OPEN JOINT-STOCK COMPANY for 2008 6
Purchase and sale transaction, in accordance with which on September 25, 2008, 344,899 ordinary shares (state registration number of the issue 1-01A dated February 6, 2004) were written off from the account of David Yakobashvili (shares were transferred to a short-term loan with the rights of beneficial ownership of shares retained) ).
Purchase and sale transaction, according to which 120,000 GDRs (ISIN US97263M3079) were debited from S.A. Plastinin’s account on 11.01.2008.
Purchase and sale transaction, in accordance with which on March 11, 2008, 100,000 ordinary shares (state registration number of the issue 1-01A dated February 6, 2004) were written off from the account of Sergey Arkadyevich Plastinin.
Purchase and sale transaction, in accordance with which on March 12, 2008, 27,000 ordinary shares (state registration number of the issue 1-01A dated February 6, 2004) were written off from the account of Sergey Arkadyevich Plastinin.
Purchase and sale transaction, in accordance with which, on April 9, 2008, 104,000 ordinary shares were written off (state registration number of the issue 1-01A dated February 6, 2004) from the account of Sergey Arkadyevich Plastinin.
06/07/2008 Plastinin S.A. transferred to the legal entity 155,000 shares as a contribution to the authorized capital.
11/06/2008 Plastinin S.A. transferred to the legal entity 150,000 GDRs (ISIN US97263M3079) as a contribution to the authorized capital.
Purchase and sale transaction, in accordance with which, on April 9, 2008, 104,000 ordinary shares were credited (state registration number of the issue 1-01A dated February 6, 2004) to the account of A.S. Orlov.
1.12. Information about the person holding the position of the sole executive body (manager, managing organization) of the company and members of the collegial executive body of the company, including their brief biographical data and ownership of the company's shares during the reporting year; information on transactions for the acquisition or alienation of shares of a joint-stock company:
– – –
During the reporting year, members of the Collegial Executive Body of the Joint Stock Company did not make any transactions to acquire or alienate shares of Open Joint Stock Company Wimm-Bill-Dann Foods.
1.13. Composition of the Audit Commission:
1. Ieshkina Irina Nikolaevna
2. Kozlova Elena Alekseevna
3. Popov Alexander Dmitrievich
4. Dzhemelinskaya Victoria Valerievna
5. Davidyuk Alexander Anatolievich
6. Tatyana Nazarova
7. Gavrilenko Lesya Mikhailovna
1.14. List of all enterprises, banks, firms, organizations and other legal entities, both in the Russian Federation and abroad, in which the Company owns more than 5% of shares (stakes):
ANNUAL REPORT OF WIMM-BILL-DANN FOOD PRODUCTS OPEN JOINT-STOCK COMPANY for 2008 8
– – –
1.15. Report on the payment of declared (accrued) dividends on the company's shares.
In 2008 no dividends were paid to the shareholders of the Company in accordance with the decision of the meeting of shareholders on non-distribution of profits (clause 3. decisions taken of the Annual General Meeting of Shareholders, Minutes No. 27-06 dated July 03, 2008).
1.16. Information on the Company's compliance with the Code of Corporate Conduct.
Corporate behavior in the Company is based on respect for the rights and legitimate interests of its members and contributes to the efficient operation of the Company, including increasing the value of the Company's assets, creating jobs and maintaining the financial stability and profitability of the Company.
1. The practice of corporate conduct provides shareholders with a real opportunity to exercise their rights related to participation in the Company.
2. The practice of corporate conduct ensures equal treatment of shareholders who own an equal number of shares of the same type (category). All shareholders have the opportunity to receive effective protection in case of violation of their rights.
3. The practice of corporate conduct ensures the implementation by the Board of Directors of the strategic management of the Company's activities and effective control over its activities executive bodies of the Company, as well as accountability of members of the Board of Directors to its shareholders.
4. The practice of corporate conduct provides the executive bodies of the Company with the opportunity to reasonably, in good faith, solely in the interests of the Company, to effectively manage the current activities of the Company, as well as the accountability of the executive bodies to the Board of Directors of the Company and its shareholders.
ANNUAL REPORT OF WIMM-BILL-DANN FOOD PRODUCTS OPEN JOINT-STOCK COMPANY for 2008 9
5. The practice of corporate conduct ensures the timely disclosure of complete and reliable information about the Company, including its financial position, economic indicators, ownership and management structure in order to enable the Company's shareholders and investors to make informed decisions.
6. The practice of corporate conduct ensures effective control over the financial and economic activities of the Company in order to protect the rights and legitimate interests of shareholders.
Provisions of the Corporate Conduct Code observed by the Company:
1. The possibility for a shareholder to put an issue on the agenda of the general meeting of shareholders or to demand the convening of a general meeting of shareholders without submitting any documents, if his rights to shares are recorded in the registry system, and if his rights to shares are recorded on a depo account , - with the provision of an extract from the depo account for the exercise of the above rights.
2. Presence in the internal documents of the Company of the procedure for registration of participants in the general meeting of shareholders.
3. Presence in the Board of Directors of the Company of at least 3 independent directors who meet the qualification standards for directors set forth in the Code.
4. Presence in the charter of a joint-stock company of a requirement to elect the Board of Directors by cumulative voting only.
5. The absence in the Board of Directors of the Company of persons who were found guilty of committing crimes in the field of economic activity or crimes against state power, the interests of public service and service in local governments or who were subject to administrative penalties for offenses in the field of entrepreneurial activity or in the field of finance, taxes and fees, securities market.
6. The Board of Directors is elected by cumulative voting. The Board of Directors holds at least four regular scheduled meetings per year, as well as additional meetings if necessary.
7. Presence in the internal documents of the Company of a description of the procedure for holding meetings of the Board of Directors.
8. Availability of internal documents approved by the Board of Directors that provide for the procedure for the formation and operation of committees of the Board of Directors.
9. Presence of a special committee of the Board of Directors - an audit committee.
Composition of the Committee: Marcus Rhodes, (Chairman), Kostikov I.V., E. Yasin E.G. Functions
Committee:
evaluation of candidates for the Company's auditors and presentation of the results of such evaluation to the Board of Directors;
assessment of the opinion of the Company's auditor prior to its presentation at the general meeting of shareholders;
assessment of the effectiveness of the Company's internal control procedures and preparation of proposals for their improvement.
10. Presence of only independent directors in the audit committee. The Audit Committee is headed by an independent director.
11. Presence of a committee of the Board of Directors - a committee for personnel and remuneration.
Composition of the committee: Yasin E. G. (Chairman), Orlov A. S., Yushvaev G. A.
ANNUAL REPORT OF WIMM-BILL-DANN FOOD PRODUCTS OPEN JOINT-STOCK COMPANY for 2008 10 The Human Resources and Remuneration Committee assists the Board of Directors in developing criteria for selecting candidates for members of the Board of Directors, in selecting or preparing recommendations to the Board of Directors on candidates to the Board of Directors for presentation at the next General Meeting of Shareholders; in the development and preparation of recommendations to the Board of Directors on improving corporate governance.
The Human Resources and Compensation Committee also assists the Management Board in the following:
Creation and implementation of a unified personnel policy for working with personnel for all enterprises that are part of the company;
Creation of policies and standards for recruitment, evaluation, rotation, release, training and development of personnel, administrative accounting;
Creation of a salary and compensation policy, as well as other employee motivation and remuneration programs (options, pension plans, social programs);
Creation of a policy on corporate culture and communications.
Management succession planning is one of the main tasks of the Board of Directors. The Human Resources and Compensation Committee, together with the Board of Directors, annually reviews the management succession plans. The policy and procedures for reviewing the performance of the Chairman of the Board, as well as policies relating to the issue of succession in the event of an emergency or resignation of the Chairman of the Board, are regularly reviewed.
12. Absence of the Company's officials in the personnel and remuneration committee.
13. Availability of the Investment and Strategic Planning Committee of the Board of Directors. Composition of the Committee: Michael O'Neill (Chairman), Dubinin M.V., Plastinin S.A.
14. Presence of a Corporate Governance Committee.
Composition of the Committee: Guy de Sellier (Chairman), D. Yakobashvili, Michael O'Neill.
15. Absence in the composition of the executive bodies of persons who are a participant, general director (manager), member of the management body or employee legal entity competing with a joint-stock company.
16. The absence in the executive bodies of the Company of persons who were found guilty of committing crimes in the field of economic activity or crimes against state power, the interests of public service and service in local governments or who were subject to administrative penalties for offenses in the field of entrepreneurial activity or in the field of finance, taxes and fees, securities market.
17. Availability of special subdivisions of the Company, the Audit Commission - performing the functions of internal control over the financial and economic activities of the company, the Internal Audit Service - assessing the effectiveness and reliability of the internal control system.
18. Absence in the composition of the Audit Commission and the Internal Audit Service of persons who were found guilty of committing crimes in the field of economic activity or crimes against state power, the interests of public service and service in local governments or who were subject to administrative penalties for offenses in the field of entrepreneurial activity or in the field of finance, taxes and fees, the securities market.
ANNUAL REPORT OF WIMM-BILL-DANN FOOD PRODUCTS OPEN JOINT-STOCK COMPANY for 2008 11
19. Absence in the composition of the Audit Commission and the Internal Audit Service of persons who are members of the executive bodies of the Company, as well as persons who are participants, a general director (manager), members of management bodies or employees of a legal entity competing with the Company.
20. Presence in the internal documents of the Company of a clause on the obligation of the Audit Commission to report the identified violations to the Board of Directors of the Company. The Internal Audit Service submits a report on the status of the internal control system to the Audit Committee under the Board of Directors.
21. Regular submission by the audit committee to the Board of Directors of information on identified violations in the course of business operations in the form of reports that contain comprehensive information about these violations, including the persons responsible for them, as well as the reasons and conditions that contributed to them commission.
22. Availability of the Company's website on the Internet and regular disclosure of information about the Company on this website.
23. Presence in the joint-stock company of a special official (corporate secretary of the Company), whose task is to ensure that the bodies and officials of the joint-stock company comply with the procedural requirements guaranteeing the exercise of the rights and legitimate interests of the shareholders of the company.
24. In order to ensure the operational management of the Company, the Board of Directors appoints the Management Board. The Management Board of the Company is accountable to the Board of Directors. It carries out its activities in accordance with the rules established by the Board of Directors and systematically reports to the Board of Directors on its activities. The Board is responsible to the shareholders. The main goal of the Management Board is to develop proposals for long-term development plans, discuss them with the Board of Directors, as well as conscientious and competent management of the Company's current activities, ensuring its long-term profitability.
25. Presence in the charter or internal documents of the Company of the procedure for electing the corporate secretary of the Company and the duties of the corporate secretary of the Company.
26. Absence in the Company's charter of releasing the acquirer from the obligation to offer shareholders to sell their ordinary shares of the Company (equity securities convertible into ordinary shares) upon takeover.
By the decision of the Board of Directors of OJSC Wimm-Bill-Dann Foods in 2004.
approved the Code of Corporate Governance. In 2008, the Board of Directors adopted a new version of the Code (Minutes No. 20-05 dated May 20, 2008).
The Code fixes the commitment of the Company to the principles of corporate governance, previously announced by the Board of Directors, developed by the World Economic Forum and the Russian Union of Industrialists and Entrepreneurs, as well as the system of relations between the shareholders of the Company, the Board of Directors, its Committees, the Secretary of the Company and the Management Board.
In its work, the Company is guided by the principles of corporate governance developed jointly by the World Economic Forum (World Economic Forum) and the Russian Union of Industrialists and Entrepreneurs, and declares its desire to follow them in practice in order to improve the corporate governance system.
The principle of effective management.
The management policy has long-term goals and is aimed at increasing shareholder value. Management acts in the interests of all groups of shareholders Principle of financial discipline 2.
ANNUAL REPORT OF WIMM-BILL-DANN FOOD PRODUCTS OPEN JOINT-STOCK COMPANY for 2008 12 The Company timely and fully discloses consolidated financial statements prepared in accordance with the Generally Recognized Accounting Principles of the United States1, as well as unconsolidated financial statements prepared in accordance with Russian Accounting Standards ( RAS), certified by qualified independent auditors. The Company's management bears personal responsibility for the completeness and reliability of the disclosed information.
The principle of transparency of the ownership structure 3.
The information disclosed makes it possible to assess the degree of control of the main groups of shareholders, including the shares of the real owners in the share capital structure.
The principle of information openness 4.
The Company promptly and fully discloses information on the main results, plans and prospects of activities, and responds to shareholders' requests Principle of guarantee of rights.
The Company guarantees all shareholders the opportunity to exercise their rights. In particular, the Company guarantees the exercise of the right to participate in the work of the Company's management bodies in accordance with the shareholder's share. The Company also guarantees compliance with the "one share - one vote" principle to the owners of voting shares.
The principle of effective control.
The Board of Directors of the Company includes independent directors and is in practice accountable to all shareholders.
The principle of fair remuneration 7.
The Company has a system for evaluating the work and remuneration of directors and management, stimulating work in the interests of all groups of shareholders and disclosed by the Company.
The principle of legality and ethics 8.
The Company operates in strict accordance with the laws of the jurisdiction in which it operates, the principles of business ethics and internal documents.
The internal documents of the Company are developed on the basis of the requirements of the legislation and the norms of corporate and business ethics.
In July 2005, the Board of Directors of OJSC Wimm-Bill-Dann Foods approved the Code of Ethics (Minutes No. 15-07 dated July 18, 2005) Principle of Active Assistance 9.
The Company is an active participant in legislative initiatives and dialogue with executive branch in matters of improving corporate governance.
In addition to the principles developed by the World Economic Forum and the Russian Union of Industrialists and Entrepreneurs, the Company independently developed and adopted the principle of internal corporate social responsibility.
The principle of internal corporate social responsibility 10.
The Company supports the basic principles of joint responsibility of business to society, promotes sustainable economic development and improves the quality of life of Russian citizens.
US GAAP
ANNUAL REPORT OF WIMM-BILL-DANN FOOD PRODUCTS OPEN JOINT-STOCK COMPANY for 2008 13II FINANCIAL AND ECONOMIC ACTIVITIES OF THE COMPANY
2.1. Characteristics of the production and commercial activities of the Company for the reporting year:
2.1.1. Position of the Company in the Industry OJSC Wimm-Bill-Dann Foods owns 39 manufacturing enterprises, as well as sales centers in 24 cities of Russia and abroad. The Company has a large diversified brand portfolio with more than 900 dairy products and more than 150 juices, fruit nectars, non-carbonated drinks and mineral water, as well as more than 50 brands baby food.
The Wimm-Bill-Dann Group is one of the largest producers of dairy products and juices. More than 74% of the WBD Group's revenue comes from the sale of dairy products, 17% of the revenue is formed by the drinks segment, which includes sales of juices and mineral water, 9% of the group's revenue is from sales of baby food.
Since its founding in 1992, the WBD Group has been a leader on the Russian food market.
The WBD Group has a number of advantages over other Russian manufacturers. These benefits include: large, underutilized manufacturing facilities allowing for organic growth without additional investment, higher product quality, a high degree of innovation, and new product development and marketing opportunities.
Other important competitive advantages of the WBD Group, which, in the opinion of the Company, will allow it to maintain its leading position in the Russian market of dairy products and juices, are: strong and diversified trademarks, stable access to sources of raw materials, emphasis on the development of new products, a modern production base and technology, external funding opportunities and strong leadership. WBD Group intends to capitalize on its advantages by implementing a strategy to promote its trademarks with an emphasis on improving product quality, developing new products that, in terms of taste and consistency, are not inferior to Western-made products. However, some Russian manufacturers have certain advantages compared to the WBD group, associated with lower production costs, in particular, due to lower advertising and transport costs. Recent industry trends also indicate that industry consolidation may lead to the emergence of large domestic manufacturers that can compete with the WBD group in the market.
Foreign companies producing dairy products have a solid advertising budget, more advanced production know-how, allowing them to offer quality products for sale on the market, produced on the basis of the latest technologies through well-established marketing systems.
Some of these companies, such as Danone, Parmalat, Campina and Erhmann, have begun investing in Russian manufacturing facilities, which could reduce the competitiveness of the WBD Group's products against those of competitors who are able to manufacture their products in Russia.
Thanks to the increased production of yoghurts and dairy desserts in Russia, the above-mentioned foreign enterprises have become the main competitors of the WBD group in this market sector.
The main task of the WBD Group is to provide customers with high quality food products through careful selection of raw materials, the use of modern production technology and strict quality control. All products of the WIMM-BILL-DANN FOOD PRODUCTS OPEN JOINT-STOCK COMPANY for 2008 14 are made according to its own recipes and indicate that the WBD group is trying to take into account the tastes of domestic consumers.
2.1.2. Priority activities of the Company The main activity of the Company is the control and management of a group of its subsidiaries and other companies affiliated with the Company that produce and sell dairy (sour-milk) products, drinks (juice products and mineral water), as well as baby food (hereinafter in conjunction with The society is referred to as the WBD group). The Company also provides for use trademarks, the owner of which it is, through the conclusion of license agreements.
At the same time, the plans for the current and future activities of the Company are inextricably linked with the plans of the WBD group.
Open Joint Stock Company "Wimm-Bill-Dann Foods" in 2008 provided comprehensive consulting services in the field of management, services for the installation, implementation and maintenance of the automated information system ERP Oracle, as well as services for the provision of trademarks for use, which it owns , by concluding licensing agreements, both on the territory of the Russian Federation and in the CIS countries: Kyrgyzstan and Ukraine. The company also provided loans to subsidiaries.
The volume of sales of goods and other goods and materials in 2008 amounted to 53,649,094 thousand rubles, the volume of sales of services for the provision of trademarks for use - 1,065,985 thousand rubles.
rubles, the volume of sales of other services - 1,340,279 thousand rubles.
Report of the board of directors (supervisory board) of the company on the results 2.2.
development of society in priority areas of its activity.
Key indicators of the Company's financial activity for the reporting year.
2.2.1. The main provisions of the accounting policy of the Company in 2008 were:
Basic approaches to the preparation of annual financial statements Accounting in the Company is maintained in accordance with Federal Law No. 129-FZ dated November 21, 1996 "On Accounting" (as amended on July 23, 1998, March 28, December 31, 2002 , January 10, May 28, June 30, 2003) and the “Regulations on Accounting and Accounting in the Russian Federation”, approved by Order of the Ministry of Finance of the Russian Federation No. 34n dated July 29, 1998 (as amended on December 30, 1999 and March 24, 2000), as well as applicable accounting regulations. The Company's financial statements for 2008 were prepared in accordance with the said Law and regulations.
fixed assets
Fixed assets are accepted for accounting at their original cost.
The initial cost of fixed assets purchased for a fee is the amount of the organization's actual costs for the acquisition, construction and manufacture, except for value added tax and other refundable taxes (except for cases provided for by the legislation of the Russian Federation). The cost of fixed assets is repaid by accruing depreciation. In 2008, the depreciation method for fixed assets was calculated using the straight-line method.
ANNUAL REPORT OF WIMM-BILL-DANN FOOD PRODUCTS OPEN JOINT-STOCK COMPANY for 2008 15 The useful life for fixed assets is determined on the basis of the order of the head of the Company, approving the useful life for each code of fixed assets according to the All-Russian Classifier of Fixed Assets (OKOF) in in accordance with the depreciation groups defined in Decree of the Government of the Russian Federation No. 1 dated 01.01.2002.
The useful lives of property, plant and equipment for depreciation used in 2007 are as follows:
– – –
A change in the initial cost of fixed assets, in which they are accepted for accounting, is allowed in cases of completion, additional equipment, reconstruction, partial liquidation and revaluation of fixed assets.
The revaluation of fixed assets by the Company in 2008 was not carried out. The Company does not create a reserve for the forthcoming repair of fixed assets.
The accounting policy for 2009 includes the following item:
Objects costing less than 20,000 rubles per unit are accounted for as part of inventories and are reflected in expenses as they are put into operation.
Analytical accounting is maintained on a sub-account opened to account 10, when the cost of objects is written off as expenses, a sub-account on account 10 is used (similar to accounting for MBP).
Intangible assets
Intangible assets are accepted for accounting at their original cost. The initial cost of intangible assets acquired for a fee is determined as the sum of actual acquisition costs, excluding value added tax and other refundable taxes (except as otherwise provided by the legislation of the Russian Federation).
Depreciation on intangible assets is carried out on a straight-line basis.
Depreciation charges on intangible assets are reflected in the accounting of the reporting period to which they relate, and are charged regardless of the results of the organization's activities in the reporting period.
ANNUAL REPORT OF WIMM-BILL-DANN FOOD PRODUCTS OPEN JOINT-STOCK COMPANY for 2008 16 The useful lives of intangible assets for depreciation purposes are given below:
– – –
For intangible assets for which it is impossible to determine the useful life, they are considered intangible assets with an indefinite useful life. With regard to such intangible assets, the presence of factors indicating the impossibility of reliably determining the useful life of this asset is reviewed annually. In the event of the termination of the existence of these factors, the useful life and the method of its depreciation are determined.
The resulting adjustments are reflected in accounting and financial statements at the beginning of the reporting year as changes in estimated values.
Accounting for inventories Accounting for inventories is carried out on the basis of the accounting regulation "Accounting for inventories" PBU 5/01, approved by order of the Ministry of Finance of the Russian Federation dated 09.06.2001 No. 44n.
Industrial stocks, containers and goods are reflected in accounting and reporting at actual cost. To account for various groups of inventory items, special sub-accounts are provided. The actual cost is determined based on the cost of their acquisition.
The actual cost of material resources at disposal is determined by the average unit cost of each type, which is determined for each type of inventory as the quotient of dividing the total cost of the type of inventory by their quantity, which is formed respectively from the cost and quantity of the balance at the beginning of the month and of the received inventory at the date of write-off or exits. The average cost is determined for each type of inventory, taking into account all analytical data on the accounts of material resources.
Inventory for which during the reporting year the market price has decreased, or they are morally obsolete, or have completely or partially lost their original qualities, are reflected in the balance sheet at the end of the reporting year at the current market value taking into account the physical state of stocks. The decrease in the cost of inventories is reflected in accounting in the form of a provision for depreciation of goods and materials.
A reserve for the decrease in the value of material assets is created for each unit of inventory accepted in accounting.
In the financial statements, the amount of raw materials, materials and similar assets is shown taking into account the created provision for depreciation of goods and materials.
Accounts receivable ANNUAL REPORT OF WIMM-BILL-DANN FOOD PRODUCTS OPEN JOINT-STOCK COMPANY for 2008 17 The Company creates a reserve for doubtful debts. In the financial statements, the amount of receivables is shown taking into account the created provision for doubtful debts.
Income Revenue accepted for accounting is recognized in an amount calculated in monetary terms, equal to the amount of receipt of cash and other property and (or) the amount of receivables (subject to the provisions of clause 3 of the Accounting Regulation "Income of the organization" PBU 9/99 N 32n "(as amended on December 30, 1999, March 30, 2001). If the amount of receipts covers only part of the proceeds, then the proceeds accepted for accounting is determined as the sum of receipts and receivables (in the part not covered by receipts ).
The proceeds are recognized by the Company in accounting if the following conditions are simultaneously met (clause 12 of PBU 9/99):
the organization has the right to receive this revenue, arising from a specific contract or otherwise confirmed as appropriate;
the amount of proceeds can be determined;
there is confidence that as a result of a particular operation there will be an increase in economic benefits;
the service is accepted by the customer;
the costs incurred or to be incurred in connection with this transaction can be determined.
For tax purposes, revenue is recognized on shipment.
Revenue from sales of products is reflected taking into account the premiums provided to customers for the fulfillment of the terms of contracts.
In 2009, proceeds from the sale of inventories will be included in other income.
Expenses Expenses are recognized in the reporting period in which they occurred, regardless of the time of actual payment of funds or other form of settlement.
The expenses of the organization for ordinary activities form:
expenses associated with the acquisition of raw materials, materials, goods and other inventories;
expenses arising directly in the process of selling goods (expenses for the maintenance and operation of fixed assets and other non-current assets, as well as for maintaining them in good condition, commercial expenses, management expenses, etc.).
Administrative and selling expenses are recognized as expenses for ordinary activities in full in the period in which they are incurred.
ANNUAL REPORT OF OPEN JOINT-STOCK COMPANY "WIMM-BILL-DANN PRODUKTY PITANIA" for 2008 18 Management and commercial expenses are distributed between the types of activities in proportion to the proceeds (excluding VAT) from the sale of products (works, services) received from various types of activities.
In 2008, the Company created a reserve for future expenses for vacation pay.
The reserve is created as follows:
1. The wage fund planned for the reporting year is determined, taking into account the UST.
2. The amount of expenses for vacation pay planned for the reporting year is determined, taking into account the UST. These expenses are defined as the product of the number of vacation days and the average daily earnings for the enterprise. To determine the average daily earnings, the planned wage fund is divided by the planned number of employees, then by 12 and by 29.6 (the average number of calendar days per month for calculating vacation pay).
3. The percentage of deductions to the reserve is determined by the formula: % of deductions = item 2 / item 1 * 100.
The percentage of deductions is rounded to the second decimal place according to the rounding rules.
4. The amounts of monthly deductions to the specified reserve are calculated according to the formula: Amount of monthly deductions = actual payroll (including UST) for the month * percentage of deductions.
5. On the last day of the current reporting year, an inventory of the reserve is carried out (comparison with the amounts actually spent on vacation pay).
The reserve for future expenses for paying vacations to employees should be adjusted based on the number of days of unused vacation, the average daily amount of expenses for paying employees (taking into account the established methodology for calculating average earnings) and mandatory deductions of the unified social tax.
Accounting for loans and credits and their servicing costs
Accounting for debts on loans and credits received by the company, as well as costs associated with the fulfillment of obligations on loans and credits received, is carried out in accordance with PBU 15/01 "Accounting for loans and loans", approved by order of the Ministry of Finance of the Russian Federation dated 02.08.01 No. 60n .
The principal amount of debt on a loan or credit received from a lender is recorded in accordance with the terms of the agreement in the amount of actually received funds or in the value of other things provided for by the agreement at the time of the actual transfer of money or other things as part of accounts payable.
Indebtedness on loans and borrowings received is transferred from long-term loans and borrowings and is reflected in short-term debt on loans and borrowings at the moment when 365 days remain before the repayment of the principal amount.
The costs of received loans and credits are recognized as expenses of the period in which they are incurred (hereinafter referred to as current expenses), with the exception of their part, which is to be included in the cost of the investment asset.
The Company calculates interest on received loans and credits in accordance with the procedure established in the loan agreement and credit agreement.
Additional costs incurred by the company in connection with obtaining loans and credits, issuing and placing loan obligations may include costs associated with:
Provision of legal and consulting services to the borrower;
ANNUAL REPORT OF WIMM-BILL-DANN FOOD PRODUCTS OPEN JOINT-STOCK COMPANY for 2008 19
Implementation of copying and duplicating works;
Payment of taxes and fees (in cases stipulated by the current legislation);
Conducting examinations;
consumption of communication services;
Other costs directly related to obtaining loans and credits, placement of loan obligations.
The inclusion by the company of additional costs associated with obtaining loans and credits, placement of loan obligations in the expenses of the reporting period is made in the period in which these expenses were recognized.
Ways of property valuation Property, liabilities and business transactions for reflection in accounting and reporting are subject to valuation. The assessment is carried out in monetary terms by summing up the actual expenses incurred.
Valuation of property acquired for a fee is carried out by summing up the actual expenses incurred for its acquisition; property received free of charge - at market value on the date of posting; property; property produced by the company itself - at the cost of its production.
Depreciation of fixed assets and intangible assets is charged regardless of the results of the organization's economic activity in the reporting period.
The use of other valuation methods, including by way of reservation, is allowed in cases stipulated by the legislation of the Russian Federation and regulations bodies that regulate accounting.
Accounting for the organization's currency accounts and transactions in foreign currency is kept in rubles based on the conversion of foreign currency at the rate of the Central Bank of the Russian Federation on the date of the transaction.
Accounting for financial investments Accounting for financial investments is carried out in accordance with RAS 19/02, approved by order of the Ministry of Finance dated 10.12.2002 No. 126n.
Financial investments include securities, including debt, contributions to the authorized capital of other organizations, loans granted to other organizations in the Russian Federation and abroad, deposits in credit institutions, receivables acquired on the basis of an assignment of the right to claim, etc. .
In the financial statements, financial investments are presented with a subdivision, depending on the maturity (maturity) for short-term (maturity less than a year) and long-term (maturity more than a year).
Long-term financial investments with a maturity of less than 365 days are reflected in a separate sub-account 58.03 "Long-term financial investments (short-term part)".
ANNUAL REPORT OF OPEN JOINT-STOCK COMPANY "WIMM-BILL-DANN FOOD PRODUCTS" for 2008 20 Financial investments are accounted for on separate sub-accounts of account 58.
Interest accrued on debt securities, as well as on loans granted, are reflected in account Dt 76-03.
Financial investments, by which the current market value can be determined, are reflected in the financial statements at the end of the reporting period at the current market value by adjusting their valuation as of the previous reporting date. This adjustment is made quarterly.
The difference between the valuation of financial investments at the current market value as of the reporting date and the previous valuation of financial investments is charged to financial results as part of operating income or expenses.
When financial investments are disposed of, their value is determined based on the assessment determined by the unit cost method.
Other Accounting for assets and liabilities denominated in foreign currency.
Accounting for assets and liabilities, the value of which is expressed in foreign currency, is carried out in accordance with the Accounting Regulation PBU 3/2000 “Accounting for assets and liabilities, the value of which is expressed in foreign currency”.
The exchange rate difference is reflected in the accounting and financial statements in the reporting period to which the date of fulfillment of payment obligations refers or for which the financial statements are prepared.
The exchange rate difference is subject to crediting to the financial results of the organization as non-operating income or non-operating expenses.
When accounting for business transactions carried out in 2008 and made in foreign currencies, the official exchange rate of the foreign currency against the ruble, which was in effect on the day of the transaction, was applied. Cash in foreign currency accounts in banks and on hand, short-term financial investments and funds in foreign currency settlements are reflected in the financial statements as of December 31, 2008 in rubles based on the official exchange rates in force on December 31, 2008. The exchange rates amounted to this date RUB 29.3804 for 1 US dollar; RUB 41.4411 for 1 euro. Exchange differences arising during the year on operations with assets and liabilities in foreign currency, as well as when recalculating them as of the reporting date, are charged to balance sheet account 91 “Other income and expenses”.
Future spending
Expenses incurred by the Company in the reporting period, but related to the following reporting periods, are reflected in the balance sheet as a separate item as deferred expenses and are subject to equal write-off during the period to which they relate.
Deferred expenses to be written off over a period of more than 1 year are reflected in Form No. 1 "Balance Sheet" in line 150 "Other non-current assets".
ANNUAL REPORT OF WIMM-BILL-DANN FOOD PRODUCTS OPEN JOINT-STOCK COMPANY for 2008 21 Other provisions The Company has separate structural subdivisions. Separate structural subdivisions include branches operating on the basis of the Regulations on the branch, developed by the parent company and approved by the head of the Company.
The Company draws up consolidated financial statements based on the data of branches and the parent company.
OKP 43 8140 TN VED TS 9031 20 0000 Verification vector comparators “UPVK-ME 61850” Form МС2.702.502 FO Manufacturer: NPP Mars-Energo LLC Legal address: Russia, 199034, St. Petersburg, 13th line V. O., d. 6-8, lit. A, room 41H CONTENTS Introduction 1 General instructions 2 Basic information 2.1 Purpose 2.2 Certificates 3 Main technical characteristics 3.1 Installation design. 3.2 Metrological characteristics 3.3 General technical characteristics 4 Completeness 5 Guarantees...»
“COLOSSIANS 3:16–4:6 2001 You are rich in abundance; teach and admonish serve the Lord Christ. 25 And whoever does one another with psalms, glorifies the right, he will receive according to his own iniquity; He has no lyceum and spiritual songs, singing in grace in your hearts of acceptance. Lord. 17 And whatever you do, CHAPTER 4 in word or deed, do everything in perseverance in prayer. the name of the Lord Jesus Christ, bless the prudence of God through Him God and the Father. G 18..."
“The Federal Chamber of Lawyers of the Russian Federation Center for Legal Research, Advocacy and Additional Professional Education of the Federal Chamber of Lawyers of the Russian Federation E. N. Kalacheva ACTIVITIES OF THE ATTORNEY TO PROVIDE LEGAL AID TO MINORS Monograph Moscow UDC 347.965 BBK 67.75 K17 Author: E. N. Kalacheva, lawyer of the Bar Association Moscow. Reviewers: Yu. S. Pilipenko, First Vice-President of the FPA RF, Managing Partner of the Moscow Collegium...»
“Introductory Information Community Based Rehabilitation CBR Guidelines WHO Library Cataloging-in-Publication Data Community-based rehabilitation: CBR guidelines.1. rehabilitation. 2. Disabled persons. 3. Community health services. 4. Health policy. 5. Human rights. 6.Social justice. 7.Consumer participation. 8. Guidelines. I. World Health Organization. II.UNESCO. III.International Labor Organization. IV. International Disability Development Consortium. ISBN 978 92 4 154805 2 (NLM classication:...»
“NEW ARRIVALS OF LITERATURE TO THE VGMHA LIBRARY in December 2014. Storage term: Subscription of scientific and educational literature; AB Reference and Information Department; SIO Reading room; ChZ Hall of normative and technical documentation; NTD Fiction Subscription; AHL Computer class. KK 1. 65.052ya73 Abdukarimov IT A 139 Accounting (financial) statements of commercial enterprises (characteristics of forms and articles, methods of reading, monitoring and preliminary analysis): textbook. allowance: for ... "
« innovative technologies (IGUPIT) Publish an article in the journal http://publ.naukovedenie.ru Internet journal "NAUKOVEDENIE" №3 2012 Trunov Ivan Trofimovich Trynov Ivan Trofimovich Rostov state building university The Rostov state building university Professor/Professor Fedotov Nikita Olegovich Fedotov Nikita Olegovich Rostov...»
“In the current period of 2015 AUK VO “Voronezh Concert Hall” APPROVED by the decision of the Board of the Chamber of Control and Accounts of the Voronezh Region dated August 31, 2015 No. 28 (166) of the work plan of the Chamber of Control and Accounts of the Voronezh Region for ... "
"Management", Krasnodar, Russia (350040, Krasnodar, Stavropolskaya st., 216), e-mail: [email protected] This article studies the conflict problems of the transfer of ownership and the risk of loss of goods in private international law. International agreements are being studied, one way or another affecting the regulation of this issue, ... "
"RUSSIAN UNIVERSITY OF FRIENDSHIP OF PEOPLES V. D. Bordunov INTERNATIONAL AIR LAW Moscow NOU VKSh "Aviabusiness" UDC (075) BBK 67.404.2ya7+67yu412ya7 B 82 Reviewers: Brylov A.N., Academician of the Russian Academy of Natural Sciences, Honored Lawyer of the Russian Federation, PhD in Law, Deputy General Director of OJSC Aeroflot - Russian Airlines; Eliseev B.P., Doctor of Law, Professor, Honored Lawyer of the Russian Federation, Deputy General Director of OJSC Aeroflot - Russian Airlines, Director of the Legal ... "
“Information provided by the Legal Department of the Duma of the City District of Samara REVIEW No. 4 of federal and regional legislation for April 2013 1. Federal legislation.1.1. Federal Law No. 05.04.2013 No. 38-FZ “On Amendments to the Housing Code of the Russian Federation and the Federal Law “On the Fund for Assistance to the Reform of the Housing and Communal Services” Entered into force on April 19, 2013. This Federal Law introduced the following amendments to the Housing Code of the Russian Federation. In accordance with part ... "
“I approve the Director of the MU “Central Library” of the ICGO “Ukhta” Tkachenko O.G. Work Plan of the Reference and Bibliographic Department of the MU “Central Library of the Municipal Public Organization “Ukhta” for 2015 Ukhta "for readers and the population of the city through traditional and new bibliographic technologies, services and services...."
"STATE TATARSTAN COMMITTEE OF THE REPUBLIC OF THE REPUBLIC OF TATARSTAN TARIFLAR BUENCHA DLT ON TARIFFS COMMITTEES dated August 29, 2013 No. 29-PR Kazan I APPROVE Acting. chairman State Committee Republic of Tatarstan at the tariffs Shtrom A.L. MINUTES of the meeting of the Board of the State Committee of the Republic of Tatarstan on Tariffs Members of the Board: Simkachev DA, Deputy Chairman; Sadykova E.D., head of the legal department; Khabibullina L.V., head of the regulation department ... "
"UDK 347.191.1 Zakharenko Diana Sergeevna Zakharenko Diana Sergeevna Candidate of Law, PhD in Law, Lecturer, Lecturer of the Department of Civil Law Civil Law Department, Kuban state university Kuban State University THE NEW CIVIL LAW REGULATIONS CONCERNING NON-PROFIT ON NON-PROFIT ORGANIZATIONS Abstract: Summary: The article considers the modern approaches to the...»
"On the organization of recreation, rehabilitation and employment of children and youth in 2015 in the Kolomensky municipal district In accordance with the Decree of the Government of the Moscow Region dated March 12, 2012 No. 269/8 "On measures to organize recreation and rehabilitation of children in the Moscow Region", decision of the Moscow Regional Coordinating Council for the organization of recreation, health improvement and employment of children dated 04/02/2015, Decree of the Government of the Moscow Region dated 03/27/2015 No. 173/11 "On approval ..."
2016 www.site - "Free digital library- Scientific publications"
The materials of this site are posted for review, all rights belong to their authors.
If you do not agree that your material is posted on this site, please write to us, we will remove it within 1-2 business days.
Full name: JSC "WIMM-BILL-DANN"
TIN: 7713085659
Type of activity (according to OKVED): 10.51 - Production of milk (except raw) and dairy products
Form of ownership: 16 - Private property
Legal form: 12200 - Joint stock companies
Reporting is done in thousand rubles
See detailed verification of the counterparty
Accounting statements for 2011-2018
1. Balance sheet
| Name of indicator | The code | #DATE# |
|---|---|---|
| ASSETS | ||
| I. NON-CURRENT ASSETS | ||
| Intangible assets | 1110 | #1110# |
| Research and development results | 1120 | #1120# |
| Intangible search assets | 1130 | #1130# |
| Tangible Exploration Assets | 1140 | #1140# |
| fixed assets | 1150 | #1150# |
| Profitable investments in material values | 1160 | #1160# |
| Financial investments | 1170 | #1170# |
| Deferred tax assets | 1180 | #1180# |
| Other noncurrent assets | 1190 | #1190# |
| Total for Section I | 1100 | #1100# |
| II. CURRENT ASSETS | ||
| Stocks | 1210 | #1210# |
| Value added tax on acquired valuables | 1220 | #1220# |
| Receivables | 1230 | #1230# |
| Financial investments (excluding cash equivalents) | 1240 | #1240# |
| Cash and cash equivalents | 1250 | #1250# |
| Other current assets | 1260 | #1260# |
| Total for Section II | 1200 | #1200# |
| BALANCE | 1600 | #1600# |
| LIABILITY | ||
| III. CAPITAL AND RESERVES | ||
| Authorized capital (share capital, authorized fund, contributions of comrades) | 1310 | #1310# |
| Own shares repurchased from shareholders | 1320 | #1320# |
| Revaluation of non-current assets | 1340 | #1340# |
| Additional capital (without revaluation) | 1350 | #1350# |
| Reserve capital | 1360 | #1360# |
| Retained earnings (uncovered loss) | 1370 | #1370# |
| Total for Section III | 1300 | #1300# |
| IV. LONG TERM DUTIES | ||
| Borrowed funds | 1410 | #1410# |
| Deferred tax liabilities | 1420 | #1420# |
| Estimated liabilities | 1430 | #1430# |
| Other liabilities | 1450 | #1450# |
| Total for Section IV | 1400 | #1400# |
| V. SHORT-TERM LIABILITIES | ||
| Borrowed funds | 1510 | #1510# |
| Accounts payable | 1520 | #1520# |
| revenue of the future periods | 1530 | #1530# |
| Estimated liabilities | 1540 | #1540# |
| Other liabilities | 1550 | #1550# |
| Section V total | 1500 | #1500# |
| BALANCE | 1700 | #1700# |
Brief balance sheet analysis
Graph of changes in non-current assets, total assets and capital and reserves by years
| financial indicator | 31.12.2018 | 31.12.2017 | 31.12.2016 | 31.12.2015 | 31.12.2014 | 31.12.2013 | 31.12.2012 | 31.12.2011 |
|---|---|---|---|---|---|---|---|---|
| Net assets | 29892708 | 33668986 | 29351141 | 28544519 | 22177681 | 21531191 | 20133326 | 16799624 |
| Autonomy coefficient (norm: 0.5 or more) | 0.56 | 0.61 | 0.57 | 0.57 | 0.51 | 0.52 | 0.5 | 0.41 |
| Current liquidity ratio (norm: 1.5-2 and above) | 1.3 | 1.2 | 1.1 | 1.1 | 0.9 | 0.9 | 1.1 | 0.8 |
2. Profit and loss statement
| Name of indicator | The code | #PERIOD# |
|---|---|---|
| Revenue | 2110 | #2110# |
| Cost of sales | 2120 | #2120# |
| Gross profit (loss) | 2100 | #2100# |
| Selling expenses | 2210 | #2210# |
| Management expenses | 2220 | #2220# |
| Profit (loss) from sales | 2200 | #2200# |
| Income from participation in other organizations | 2310 | #2310# |
| Interest receivable | 2320 | #2320# |
| Percentage to be paid | 2330 | #2330# |
| Other income | 2340 | #2340# |
| other expenses | 2350 | #2350# |
| Profit (loss) before tax | 2300 | #2300# |
| Current income tax | 2410 | #2410# |
| including permanent tax liabilities (assets) | 2421 | #2421# |
| Change in deferred tax liabilities | 2430 | #2430# |
| Change in deferred tax assets | 2450 | #2450# |
| Other | 2460 | #2460# |
| Net income (loss) | 2400 | #2400# |
| FOR REFERENCE | ||
| Result from the revaluation of non-current assets, not included in the net profit (loss) of the period | 2510 | #2510# |
| Result from other operations, not included in the net profit (loss) of the period | 2520 | #2520# |
| Cumulative financial result of the period | 2500 | #2500# |
Brief analysis of financial results
Schedule of changes in revenue and net profit by years
| financial indicator | 2018 | 2017 | 2016 | 2015 | 2014 | 2013 | 2012 |
|---|---|---|---|---|---|---|---|
| EBIT | 7791621 | 7866739 | 5071713 | 8311411 | 5154804 | 3482603 | 4792427 |
| Profitability of sales (profit from sales in each ruble of revenue) | 8.1% | 7.8% | 4.7% | 6.8% | 6.2% | 5.3% | 7.5% |
| Return on equity (ROE) | 19% | 18% | 13% | 25% | 17% | 11% | 19% |
| Return on assets (ROA) | 11.1% | 10.8% | 7.5% | 13.6% | 8.6% | 5.4% | 8.7% |
4. Cash flow statement
| Name of indicator | The code | #PERIOD# |
|---|---|---|
| Cash flows from current operations | ||
| Income - total | 4110 | #4110# |
| including: from the sale of products, goods, works and services |
4111 | #4111# |
| lease payments, license payments, royalties, commissions and other similar payments | 4112 | #4112# |
| from the resale of financial investments | 4113 | #4113# |
| other supply | 4119 | #4119# |
| Payments - total | 4120 | #4120# |
| including: to suppliers (contractors) for raw materials, materials, works, services |
4121 | #4121# |
| in connection with the remuneration of employees | 4122 | #4122# |
| interest on debt obligations | 4123 | #4123# |
| corporate income tax | 4124 | #4124# |
| other payments | 4129 | #4129# |
| Balance of cash flows from current operations | 4100 | #4100# |
| Cash flows from investment operations | ||
| Income - total | 4210 | #4210# |
| including: from the sale of non-current assets (except for financial investments) |
4211 | #4211# |
| from the sale of shares of other organizations (participatory interests) | 4212 | #4212# |
| from the return of loans granted, from the sale of debt securities (rights to claim funds from other persons) | 4213 | #4213# |
| dividends, interest on debt financial investments and similar income from equity participation in other organizations | 4214 | #4214# |
| other supply | 4219 | #4219# |
| Payments - total | 4220 | #4220# |
| including: in connection with the acquisition, creation, modernization, reconstruction and preparation for the use of non-current assets |
4221 | #4221# |
| in connection with the acquisition of shares of other organizations (participation interests) | 4222 | #4222# |
| in connection with the acquisition of debt securities (the rights to claim funds from other persons), the provision of loans to other persons | 4223 | #4223# |
| interest on debt obligations included in the cost of an investment asset | 4224 | #4224# |
| other payments | 4229 | #4229# |
| Balance of cash flows from investment operations | 4200 | #4200# |
| Cash flows from financial transactions | ||
| Income - total | 4310 | #4310# |
| including: obtaining credits and loans |
4311 | #4311# |
| cash deposits of owners (participants) | 4312 | #4312# |
| from issuance of shares, increase in participation | 4313 | #4313# |
| from the issuance of bonds, bills of exchange and other debt securities, etc. | 4314 | #4314# |
| other supply | 4319 | #4319# |
| Payments - total | 4320 | #4320# |
| including: owners (participants) in connection with the redemption of shares (participatory interests) of the organization from them or their withdrawal from the membership |
4321 | #4321# |
| to pay dividends and other payments | 4322 | #4322# |
| on the distribution of profits in favor of the owners (participants) in connection with the redemption (repurchase) of promissory notes and other debt securities, the return of loans and borrowings | 4323 | #4323# |
| other payments | 4329 | #4329# |
| Balance of cash flows from financial operations | 4300 | #4300# |
| Balance of cash flows for the reporting period | 4400 | #4400# |
| Balance of cash and cash equivalents at the beginning of the reporting period | 4450 | #4450# |
| Balance of cash and cash equivalents at the end of the reporting period | 4500 | #4500# |
| The magnitude of the impact of changes in the foreign exchange rate against the ruble | 4490 | #4490# |
6. Report on the intended use of funds
| Name of indicator | The code | #PERIOD# |
|---|---|---|
| Balance at the beginning of the reporting year | 6100 | #6100# |
| Funds received | ||
| Entry fees | 6210 | #6210# |
| Membership fee | 6215 | #6215# |
| earmarked contributions | 6220 | #6220# |
| Voluntary property contributions and donations | 6230 | #6230# |
| Profit from income-generating activities of the organization | 6240 | #6240# |
| Other | 6250 | #6250# |
| Total funds received | 6200 | #6200# |
| Funds used | ||
| Expenses for targeted activities | 6310 | #6310# |
| including: | ||
| social and charitable assistance | 6311 | #6311# |
| holding conferences, meetings, seminars, etc. | 6312 | #6312# |
| other events | 6313 | #6313# |
| The cost of maintaining the administrative apparatus | 6320 | #6320# |
| including: | ||
| payroll expenses (including accruals) | 6321 | #6321# |
| payments not related to wages | 6322 | #6322# |
| travel and business travel expenses | 6323 | #6323# |
| maintenance of premises, buildings, vehicles and other property (except for repairs) | 6324 | #6324# |
| repair of fixed assets and other property | 6325 | #6325# |
| others | 6326 | #6326# |
| Acquisition of fixed assets, inventory and other property | 6330 | #6330# |
| Other | 6350 | #6350# |
| Total funds used | 6300 | #6300# |
| Balance at the end of the reporting year | 6400 | #6400# |
2018 2017 2016 2015 2014 2013 2012
No data for this period
| Name of indicator | The code | Authorized capital | own shares, purchased from shareholders |
Extra capital | Reserve capital | Undestributed profits (uncovered loss) |
Total |
|---|---|---|---|---|---|---|---|
| The amount of capital on | 3200 | ||||||
| Behind Capital increase - total: |
3310 | ||||||
| including: net profit |
3311 | X | X | X | X | ||
| property revaluation | 3312 | X | X | X | |||
| income attributable directly to capital increases | 3313 | X | X | X | |||
| additional issue of shares | 3314 | X | X | ||||
| increase in the par value of shares | 3315 | X | X | ||||
| 3316 | |||||||
| Decrease in capital - total: | 3320 | ||||||
| including: lesion |
3321 | X | X | X | X | ||
| property revaluation | 3322 | X | X | X | |||
| expenses attributable directly to depreciation of capital | 3323 | X | X | X | |||
| depreciation of shares | 3324 | X | |||||
| reduction in the number of shares | 3325 | X | |||||
| reorganization of a legal entity | 3326 | ||||||
| dividends | 3327 | X | X | X | X | ||
| Change in additional capital | 3330 | X | X | X | |||
| Change in reserve capital | 3340 | X | X | X | X | ||
| The amount of capital on | 3300 |
Additional checks
Check counterparty Download data for financial analysis
* An asterisk indicates indicators that are adjusted in comparison with Rosstat data. The adjustment is necessary to eliminate obvious formal inconsistencies in reporting indicators (difference in the sum of lines with the final value, typos) and is carried out according to an algorithm specially developed by us.
Reference: The financial statements are presented according to Rosstat data, disclosed in accordance with the legislation of the Russian Federation. The accuracy of the given data depends on the accuracy of the data submission to Rosstat and the processing of these data by the statistical agency. When using this reporting, we strongly recommend that you check the figures with the data of the paper (electronic) copy of the reporting posted on the official website of the organization or received from the organization itself. The financial analysis of the presented data is not part of the Rosstat information and is performed using a specialized
Preparation of the balance sheet and income statement of the enterprise. Calculation of the availability of own current and non-current assets. Solvency assessment, calculation of net assets. Analysis of financial stability indicators and profitability indicators.
Send your good work in the knowledge base is simple. Use the form below
Students, graduate students, young scientists who use the knowledge base in their studies and work will be very grateful to you.
Posted on http://www.allbest.ru/
1. Description of the enterprise
2. Accounting statements for 2011 and 2010
2.1 Balance sheet for 2011
2.2 Profit and loss statement for 2011
2.3 Balance sheet for 2010
2.4 Profit and loss statement for 2010
3. Analysis of financial and economic activities
3.1 Analysis of the composition and structure of the property of the enterprise
3.2 Calculation of own current and non-current assets
3.3 Analysis of the composition and structure of the sources of the enterprise
3.4 Calculation of net assets
3.5 Solvency assessment
3.6 Analysis of financial stability indicators
3.7 Analysis of profits and their use
3.8 Analysis of profitability indicators
3.9 Comparative analytical balance sheet of the enterprise
3.10 Determining the type of situation at the enterprise for the reporting year
3.11 Liquidity analysis of the company's balance sheet
Opinion on the financial analysis of JSC Wimm-Bill-Dann
1. Description of the enterprise
balance solvency financial profitability
Wimm-Bill-Dann is the market leader in dairy products and baby food in Russia and one of the leading players in the soft drinks market in Russia and the CIS countries. Wimm-Bill-Dann owns more than 35 processing plants in Russia, Ukraine and Central Asia. Wimm-Bill-Dann has created a unified production network in the regions of Russia and the CIS countries, becoming a nationwide Russian manufacturer.
Now the Wimm-Bill-Dann group of companies includes 37 manufacturing enterprises. WBD's strategy is to produce dairy products in the region where they are consumed, supplying the Russian market with the best dairy products at affordable prices.
Each plant, each enterprise of the company is unique, but they are united by one thing - the high quality of products. A total of more than 18 thousand people work at these enterprises and in WBD trade branches.
Our most recognizable brands are House in the Village, Chudo, Cheerful Milkman, Bio-Max, Imunele and Lamber. We own the most famous Russian juice brand - J7. No less popular are the brands "Lubimiy Sad", "Miracle Berry", "Essentuki". Our Agusha brand is the most recognizable baby food brand in Russia.
Mission company reflects our fundamental values:
Wimm-Bill-Dann helps people, delighting them every day with tasty and healthy food for the whole family.
One of the most important reasons for the successful business of Wimm-Bill-Dann was the cooperation with the transnational corporation Tetra Pak, the world leader in the production of equipment and materials for aseptic packaging of liquid food products. Nearly half a century ago, Tetra Pak developed the now-famous rectangular beverage carton pack, which has gained wide popularity among consumers around the world due to its reliability and convenience. The partnership between Wimm-Bill-Dann and Tetra Pak can without exaggeration be called strategic and aimed at long-term mutually beneficial cooperation.
The Wimm-Bill-Dann Group maintains partnership relations with such well-known companies as SIG Combibloc, GEA Finnah, Senaplast, APV. The installation of TVA filling machines, GEA Finnah lines, Mariani (Italy) sterile air production systems and washing systems at Wimm-Bill-Dann enterprises makes it possible to improve the quality and consumer properties of products, provide products with convenient packaging for the buyer, and optimize production processes.
The cooperation between Wimm-Bill-Dann and the transnational company Cargill, the world's largest supplier of juice concentrates, deserves special mention. In cooperation with Cargill, we managed to create a series of J-7 juices, which is the “visiting card” of our company and the best-selling juice brand in Russia. Through collaboration with Cargill, the J-7 has become a recognized benchmark for all Russian manufacturers juices and juice drinks.
One of the main missions of Wimm-Bill-Dann is working for the benefit of the Russian economy, striving to make the most of the opportunities of Russian suppliers of raw materials, equipment and packaging. Today, Wimm-Bill-Dann cooperates with such manufacturers of packaging materials as Ruskart, Soyuz and BFK-Invest. Currently, Wimm-Bill-Dann Group companies use the services of 286 suppliers, including 251 Russian company. The number of Wimm-Bill-Dann suppliers is constantly growing.
Wimm-Bill-Dann was especially proud of the high appreciation of its products by the largest Western corporations operating in the Russian market. For example, Wimm-Bill-Dann has become a supplier of Russian fast food restaurants of the McDonald's network. The agreements with McDonald's involve increasing the supply of milk from Wimm-Bill-Dann as new chain restaurants open in Russian cities.
Another strategically important partner of Wimm-Bill-Dann is Kellog's, a world-famous manufacturer of cereals and breakfast cereals. Moscow stores regularly host tastings of Kellog's breakfast cereals using Wimm-Bill-Dann's dairy products
2. Accounting statements 2011 and 2010G.
2.1 Balance sheet for 2011
BALANCE SHEET
|
The form № 1 according to OKUD |
||||
|
Date (year, month, day) |
||||
|
Organization JSC "Vimm-B"ill-Dann" OKPO |
||||
|
Taxpayer Identification Number TIN |
||||
|
Kind of activity Dairy productionproducts OKVED |
||||
|
Organizational and legal form / form of ownership Public corporation/private property under OKOPF/OKFS |
||||
|
Unit of measurement: thousand rubles by OKEI |
||||
|
Location (address) 127591 , Moscow, Dmitrovskoe highway, d. 108 |
||||
|
Approval date |
||||
|
Date of dispatch (acceptance) |
||||
|
Indicator code |
At the beginning of the reporting year |
At the end of the reporting period |
||
|
I. FIXED ASSETS Intangible assets |
||||
|
fixed assets |
||||
|
Construction in progress |
||||
|
Deferred tax assets |
||||
|
Other noncurrent assets |
||||
|
TOTAL but section I |
Form 0710001
|
IICURRENT ASSETS |
||||
|
including: raw materials, materials and other similar values |
||||
|
1 .749.843 |
||||
|
goods shipped |
||||
|
future spending |
||||
|
other inventories and expenses |
||||
|
Accounts receivable (payments of which are expected more than 12 months after the reporting date) |
||||
|
Accounts receivable (for which payments are expected within 12 months after the reporting date) |
||||
|
Cash |
||||
|
Other current assets |
||||
|
TOTAL but section II |
||||
|
BALANCE |
Form 071 LLC 1 s.
|
Indicator code |
At the beginning of the reporting year |
At the end of the reporting period |
||
|
III. CAPITAL ANDRESERVES Statutory capital |
||||
|
Extra capital |
||||
|
Reserve capital |
||||
|
including: reserves formed in accordance with the law |
||||
|
TOTAL for Section III |
||||
|
IVLONG TERM DUTIES Loans and credits |
||||
|
TOTAL but section IV |
||||
|
VSHORT-TERM LIABILITIES Loans and credits |
||||
|
Accounts payable |
||||
|
debt but taxes and fees |
||||
|
other creditors |
||||
|
revenue of the future periods |
||||
|
Reserves for future expenses |
||||
|
TOTAL but section V |
||||
|
BALANCE |
||||
|
including leasing |
||||
|
Goods accepted for commission |
||||
|
Security for obligations and payments issued |
||||
|
Depreciation of the housing stock |
||||
|
Depreciation of objects of external improvement and other analogues / objects |
||||
|
Intangible assets received for use |
||||
|
Forms of strict reporting |
||||
|
Fixed assets on lease |
||||
|
including those transferred to sub-leasing |
2.2 Profit and loss statement for 2011
|
Indicator |
During the reporting period |
For the same period of the previous year |
||
|
Name |
||||
|
Income and expenses for ordinary activities |
||||
|
Gross profit |
||||
|
Selling expenses |
||||
|
Management expenses |
||||
|
Profit (loss) from sales |
3, 726388 |
|||
|
Other income and expenses Interest receivable |
||||
|
Percentage to be paid |
||||
|
Other income |
||||
|
other expenses |
||||
|
Profit (loss) before tax |
4, 272.169 |
|||
|
Deferred tax assets |
||||
|
Deferred tax liabilities |
||||
|
Current income tax |
||||
|
Current income tax (past reporting periods) |
||||
|
Other profits (losses) |
||||
|
Net income (loss) reporting period |
||||
|
FOR REFERENCE |
||||
|
Vast earnings (loss) per share |
||||
2.3 Balance sheet for 2010
|
At the beginning of the reporting |
At the end of the reporting |
|||
|
indicator |
||||
|
I. FIXED ASSETS |
||||
|
Intangible assets |
||||
|
fixed assets |
||||
|
Construction in progress |
||||
|
Profitable investments in material values |
||||
|
Long-term financial investments |
||||
|
Deferred tax assets |
||||
|
Other noncurrent assets |
||||
|
TOTAL for Section I |
||||
|
II. CURRENT ASSETS |
||||
|
including: raw materials, materials and other similar values |
||||
|
animals for growing and fattening |
||||
|
work in progress costs |
||||
|
finished goods and goods for resale |
||||
|
goods shipped |
||||
|
future spending |
||||
|
other inventories and expenses |
||||
|
Value added tax on acquired valuables |
||||
|
Accounts receivable (for which payments are expected more than 12 months after the reporting date) |
||||
|
Accounts receivable (for which payments are expected within 12 months after the reporting date) |
||||
|
including: buyers and customers |
||||
|
Short-term financial investments |
||||
|
Cash |
||||
|
Other current assets |
||||
|
TOTAL for section II |
||||
|
BALANCE |
|
Indicator code |
Back to top reporting period |
At the end of the reporting period |
||
|
III. CAPITAL AND RESERVES Authorized capital |
||||
|
Own shares repurchased from shareholders |
||||
|
Extra capital |
||||
|
Reserve capital |
||||
|
including: reserves formed in accordance with the law |
||||
|
reserves formed in accordance with constituent documents |
||||
|
Retained earnings (uncovered loss) |
||||
|
TOTAL for Section III |
||||
|
IV. LONG TERM DUTIES Loans and credits |
||||
|
Deferred tax liabilities |
||||
|
Other long-term liabilities |
||||
|
TOTAL for section IV |
||||
|
V. SHORT-TERM LIABILITIES Loans and credits |
||||
|
Accounts payable |
||||
|
including: suppliers and contractors |
||||
|
debt to the staff of the organization |
||||
|
debt to state off-budget funds |
||||
|
debt on taxes and fees |
||||
|
other creditors |
||||
|
Debt to the participants (founders) for the payment of income |
||||
|
revenue of the future periods |
||||
|
Reserves for future expenses |
||||
|
Other current liabilities |
||||
|
TOTAL for Section V |
||||
|
BALANCE |
||||
|
Certificate of availability of valuables recorded on off-balance accounts Leased fixed assets |
||||
|
including leasing |
||||
|
Inventory assets accepted for safekeeping |
||||
|
Goods accepted for commission |
||||
|
Written-off debt of insolvent debtors |
||||
|
Collateral for obligations and payments received |
||||
|
Security for obligations and payments issued |
||||
|
Depreciation of the housing stock |
||||
|
Depreciation of objects of external improvement and other similar objects |
||||
|
Intangible assets received for use |
||||
|
Materials accepted for recycling |
||||
|
Equipment accepted for installation |
||||
|
Forms of strict reporting |
||||
|
Fixed assets on lease |
||||
|
including sub-leasing |
||||
2.4 Profit and loss statement for 2010
|
Indicator |
For the reporting |
For the same period |
||
|
Name |
previous year |
|||
|
Income and expenses from ordinary activities Proceeds (net) from the sale of goods, products, works, services (net of value added tax, excises and similar obligatory payments) |
||||
|
Cost of sold goods, products, works, services |
||||
|
Gross profit |
||||
|
Selling expenses |
||||
|
Management expenses |
||||
|
Profit (loss) from sales |
||||
|
Other income and expenses Interest receivable |
||||
|
Percentage to be paid |
||||
|
Income from participation in other organizations |
||||
|
Other income |
||||
|
other expenses |
||||
|
Profit(lesion) before tax |
||||
|
Deferred tax assets |
||||
|
Deferred tax liabilities |
||||
|
Current income tax |
||||
|
Current income tax (past reporting periods) |
||||
|
Other similar payments (tax sanctions) |
||||
|
Other profits (losses) |
||||
|
Net profit (loss) of the reporting period |
||||
|
FOR REFERENCE Permanent tax liabilities (assets) |
||||
|
Basic earnings (loss) per share |
||||
|
Diluted earnings (loss) per share |
3. Analysis of financial and economic activities
3.1 Analysis of the composition and structure of the property of the enterprise
Table 1
|
Analysis of the composition and structure of property |
||||||||
|
Indicators |
At the beginning of the reporting period |
at the end of the reporting period |
changes for the reporting period |
% to total changeen (struct-rasset change |
||||
|
thousand roubles |
% to total (assets) |
thousand roubles |
% of total (assets) |
thousand roubles |
%to the beginning of the yeartotal assets. |
|||
|
Fixed assets: |
Fixed assets: |
|||||||
|
intangible assets |
||||||||
|
fixed assets |
||||||||
|
Construction in progress |
||||||||
|
long-term financial investments |
||||||||
|
Other noncurrent assets |
||||||||
|
th assets: |
||||||||
|
inventory and costs |
||||||||
|
accounts receivable |
||||||||
|
short-term financial investments |
||||||||
|
cash |
||||||||
|
Other current assets |
||||||||
|
total: |
||||||||
|
Total: |
Consider the table above. It shows that the balance sheet for the reporting period increased by almost 8 billion rubles, i.е. by 0.25%, which is a positive trend. Revenues under code 110 for the reporting period increased by 11 billion rubles, which amounted to almost 122%. (See Form 2 for 2011)
Such good results were achieved primarily due to the increase in production volumes, respectively, increased inventory and costs by 3.25%. As a result, the volume of the enterprise's cash increased by 1%, but such a small increase may cause some concerns among creditors. Other current assets grew during the reporting period by 0.8%, this was facilitated by the purchase of own shares for further resale. In total, the group of current assets increased by 0.66% over the year, which amounted to 3,648,914 thousand rubles, despite the fact that indicators of short-term financial investments fell by more than 2.5%
Non-current assets for the year increased by 0.24, which in monetary terms amounted to 4,177,875 thousand rubles. It can be seen from the calculations that, in general, there is no negative dynamics in the group, but the increase is not significant, on average it amounted to 0.5. It is worth noting that this group also reflected own shares purchased by the plant, as well as investing money in the construction of a plant in St. Petersburg.
In general, we can observe that non-current assets occupy a large share in the balance sheet, which indicates high level quality of non-current assets, however, over the year they grew 3 times less than fixed assets, which suggests that the shareholders were not interested in long-term investments, and were aimed at maximizing profit from the enterprise.
3.2 Calculation of own current and non-current assets
Table 2-a Calculation of the availability of own working capital
|
No. p / p |
indicators |
at the beginning of the reporting |
at the end of the reporting |
Change-I am for reporting |
|
|
sources of own funds (section 3 of liabilities) |
|||||
|
long-term loans and borrowings (4 section of liabilities) |
|||||
|
sources of own funds (1 point + 2) |
|||||
|
non-current assets (1 asset section) |
|||||
|
availability of own working capital (item 3-4) |
|||||
|
|
Table 2-b
|
No. p / p |
indicators |
at the beginning of the reporting |
at the end of the reporting |
Change-I am for reporting |
|
|
inventory and costs |
|||||
|
cash |
|||||
|
accounts receivable |
|||||
|
Other current assets |
|||||
|
total working capital |
|||||
|
short-term loans, settlements and other liabilities |
|||||
|
availability of own working capital (5 indicator-6) |
|||||
|
share of own working capital in general |
From the above calculations, the following conclusions can be drawn:
Equity in current assets is about 25%, which is most likely due to the peculiarities of production. Since the cycle of production and sale of goods takes an average of 2-5 days, the delay in debit payments is 3-5 days, for key customers an average of 14 days. That is, the money spent on production is partially returned after 5 days, and the whole amount is credited to the company's accounts in 14 days. Thus, it is cheaper for an organization to resort to short-term loans from time to time, rather than to raise funds from non-current assets, etc.
It should be noted that own funds (SOS) in the considered accounting period do not cover the amount of borrowed funds, which may indicate the illiquidity of the enterprise.
However, as we can see, even in the negative trend there are positive aspects, the share of SOS did not rise, but did not fall either, on the basis of which, we can conclude that the company is struggling with this phenomenon. Also, the stability of the results gives us the right to assume that the company has its own constant market share, and should work to increase this share in future periods.
3.3 Analysis of the composition and structure of the sources of the enterprise
Table 3 Analysis of the composition and structure of enterprise sources
|
Indicators |
At the beginning of the reporting period |
at the end of the reporting period |
changes during the reporting period |
% to total change |
||||
|
thousand roubles |
% to total |
thousand roubles |
% to total |
thousand roubles |
%to the beginning of the year |
|||
|
Own funds (capital and reserves): |
||||||||
|
authorized capital |
||||||||
|
Extra capital |
||||||||
|
Reserve capital |
||||||||
|
target financing and target receipt |
||||||||
|
retained earnings |
||||||||
|
uncovered loss |
||||||||
|
Borrowed funds and liabilities: |
||||||||
|
long-term credits and loans |
||||||||
|
short-term credits and loans |
||||||||
|
accounts payable |
||||||||
|
dividend payments |
||||||||
|
revenue of the future periods |
||||||||
|
reserves for future expenses and payments |
||||||||
|
other short-term liabilities |
||||||||
This table shows that during the reporting period it was not possible to bring own funds and borrowed funds to the ratio of 50/50. Despite all the efforts of top management: an increase in the authorized capital, the introduction of additional capital, the amount of borrowed funds increased by 22% compared to the previous year, while equity increased by only 2% over the same period, which amounted to 6 billion rubles. rub. and 700 million rubles. respectively.
However, despite the large change in the structure of liabilities in the direction of an increase in AP and liabilities, the company managed to stay within the limits of close to optimal ratio of equity and borrowed capital. This was mainly achieved by increasing accounts payable (as can be seen from the company's balance sheet, 70% of this debt is debt to suppliers.), Which allowed to increase the volume of stocks, and as a result, the volume of production.
Thus, we can conclude that the organization formed working capital at the expense of debts to suppliers. And if at the beginning of the year the organization could still cover its debts and come out with + 9%, then at the end of the year the situation changed exactly the opposite, since by the end of the year the amount of borrowed funds increased by 6 billion rubles, and CC by only 705,071 thousand rubles. r., i.e. 110%
3.4 Calculation of net assets
Table No. 4
Similar Documents
Economic essence and types of profit. The theory of enterprise profit management. The main groups of profitability indicators. Analysis of the main financial and economic indicators of the Wimm-Bill-Dann corporation. Evaluation of corporate profitability indicators.
term paper, added 11/11/2014
Consideration of the features of the calculation of the availability of own working capital of the enterprise. Characteristics of the main indicators of financial stability, stages of calculation of net assets. Analysis of the comparative analytical balance of the enterprise for the reporting period.
test, added 04/04/2013
The concept of solvency and approaches to its assessment. Coefficients characterizing solvency. Analysis of the composition, structure and dynamics of assets and sources of formation of the organization's property, financial stability, turnover of current assets.
term paper, added 05/26/2015
Calculation of indicators of dynamics and balance structure. Analysis of indicators of sustainability, liquidity and solvency of the enterprise. Analysis of the turnover of working capital. Assessment of the level and dynamics of indicators of balance sheet and net profit of the enterprise.
test, added 04/29/2011
Analytical grouping and analysis of the assets of the balance sheet of the enterprise. general characteristics and valuation of net current assets. Dynamics of own working capital and the magnitude of the sources of formation of reserves and costs. Solvency ratios.
presentation, added 06/15/2011
The concept of financial condition and indicators characterizing it. Brief economic description of JSC "Wimm-Bill-Dann". Analysis of financial stability, provision of reserves with sources of their formation. Analysis of liquidity and solvency.
term paper, added 12/15/2010
Financial analysis of the activities of OAO VimpelCom. Horizontal and vertical analysis of the balance sheet. Evaluation of indicators of solvency, liquidity, financial stability, business activity, profit, profitability. Calculation of cash flows.
term paper, added 02/12/2012
Study of the composition, dynamics and structure of the enterprise's property, assessment of its property status, structure of invested capital. Assessment of net assets and net current assets. Analysis of financial stability, solvency of the enterprise.
test, added 09/06/2014
Analysis of indicators of liquidity and profitability of the enterprise, the structure of the asset and liabilities of the balance sheet. Evaluation of the solvency of the organization. The study of indicators of financial stability. Calculation of indicators of business activity of a modern enterprise.
term paper, added 08/23/2014
Analysis of the influence of factors on the volume of production, indicators of the movement and constancy of personnel, composition, dynamics and structure of the property of the enterprise. Valuation of net assets and current assets. Analysis of financial stability and solvency of the enterprise.